


SEO Analytics
TABLE OF CONTENTS
Profit.Store

419
In simple words, SEO is the promotion of a site in organic search for specific key queries. SEO is an effective marketing promotion tool and, at the same time, the least predictable. Therefore, let's talk about what is essential about SEO and what indicators need to be tracked to the search system to raise the site by positions.
General Statistics
Let's move on to analytics. Next, I will tell you about the main board and how each process is detailed separately.
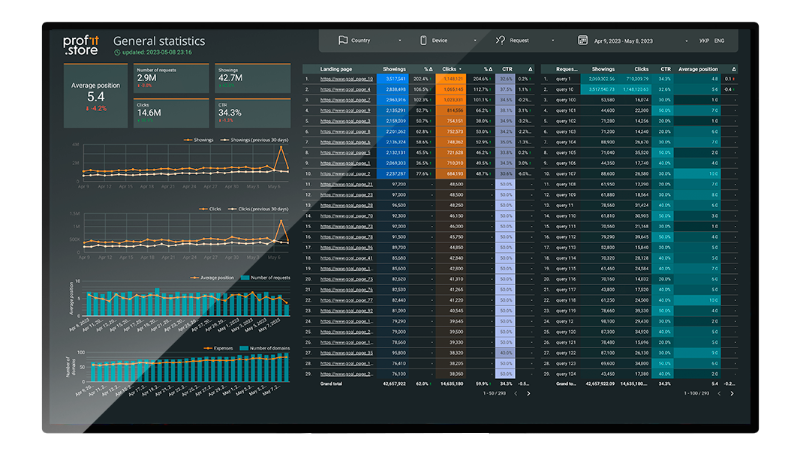
It shows the data and compares it with the past period of 30 days. Why 30? Because, on average, indexing takes 24 days.
The dashboard shows a graph of the average position and the number of requests. For example, the average position should decrease: the lower the average position, the higher the site's position in Google. If there are 10 queries in Google and you are on 2-5 positions for each, then it is clear that the average position is small. If your position is 20-40-80, then the average will be the arithmetic mean of these positions.
Let's imagine the situation. You have published 10 articles on the site in a month. New semantics appeared in these articles (keywords that you did not use before), you published a link profile for new articles, everything got indexed, and you got new positions in Google. Before, there were 100 positions conventionally. Now, there are 112. Now the arithmetic average will be much higher due to the new positions that have appeared. It's good. You got new positions at Google. Now you can optimize and lift them. But when the client sees that the average position is growing and not falling, he says, "But I'm paying money for SEO!". Let me explain: you had 30,000 requests that month, and you have 38,000 requests this month. 30,000 requests have kept your positions and even grown, and the new positions we got from newly published content affect the arithmetic average. These indicators cannot be viewed separately but only together: the average position and the number of requests in the search engine.
On the right, the graph shows costs and the number of domains. These are domains that we buy on exchanges, publish in the media, and make announcements. Everything you bought, your entire link profile, is on this graph. We can see here how many domains we bought every month and how much we spent on them.
There are also landing pages. It is important to promote not only the site's main page but also categories and some articles with keywords. Each page has analytics: behavioral factors, link profiles, etc.
A link profile can generally consist of different types of donor domains that link to your site.
For example, you have published an article in a media that links to your site. This media's domain trust is 1000, and yours is 10. Because a great trust domain links to you, you get +1,+2, or +10… depending on the domain size.
If you make 100 publications in the media, they will delegate a piece of trust to you, and when asked in the search bar, Google will understand that 1000 different sites link to your site, which means that it should be promoted higher.
If you thoughtlessly buy links on exchanges that will refer to you, you risk getting banned by Google. This is a sure way to immediately bury the project because getting out of the ban is a long and expensive process. Usually, a link profile is made in the proportions: SEO links with anchors (20%) and organic links without anchors (80%).
At the same time, exchanges mainly sell only anchored links, and we need anchorless ones. What shall we do?
The answer is crowd marketing. This is the publication of links in comment blocks on forums. The trust in forums is great because they have many active users. These giant sites are many years old. A forum link costs about UAH 40, and on the stock exchange website, it costs USD 98. When I buy links on forums for clients, I get at least 30 organic links from forums per month, 2-3 links in media, and 10-15 links on exchanges. In this way, many domains meet Google's requirements.
But there is another point - indexing time. If it's a media publication, Google indexes it daily. If the site has little content, it is rarely indexed. Forums are indexed with a delay because normal content as articles and posts, has not appeared there for a long time. So if you bought 30 links, 2-3 links in the media, and 10-15 links on exchanges, then you can get banned by Google very easily because the media will publish and index the content on the very first day, links from the exchange - within 10 days, and forum links - at least 24 days. That is, the index will not have the necessary link mass to meet Google's rules.
I often observe this situation with clients: there is one page with behavioral factors with a bounce rate of 60% and other pages with a bounce rate of a maximum of 5%. The site is not growing. And the client forgot that he once published an article that was published in organic, but it is not relevant. At the same time, it still continues to be clicked on. The site will not grow because this article is the anchor that holds the site because of poor behavioral factors. This page should be excluded from indexing so that Google does not see it. You cannot delete content. Hide it from indexing so that it stops inhibiting indexing.
On the dashboard, there is a target page, the number of views of each page in the organic edition, delta (comparison with the selected period in the past), and clicks. We see how many times the page was displayed and how many displays were clicks and CTR, and we can understand whether they are growing or falling in terms of each page.
Details of indicators
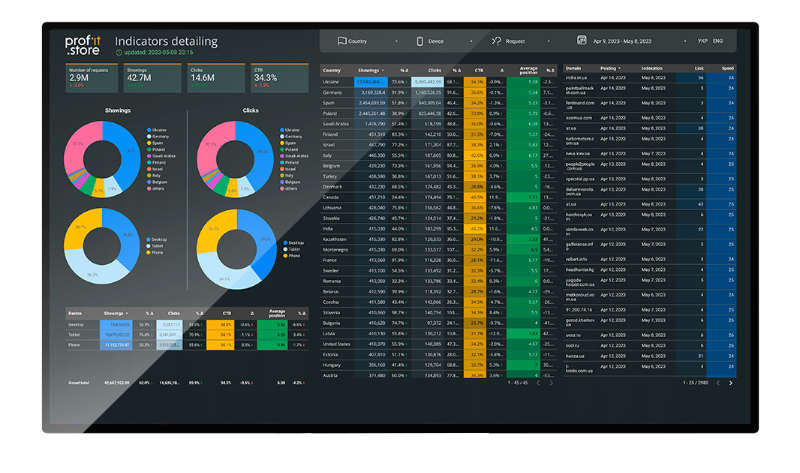
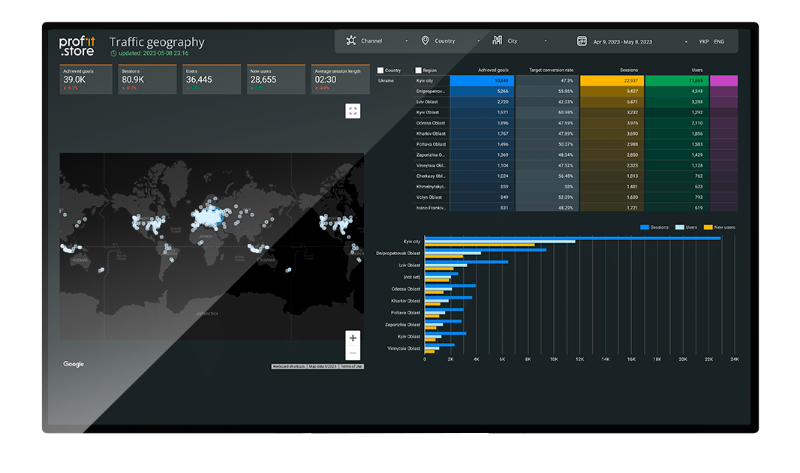
This dashboard shows the geography of traffic: for each country, the number of impressions, clicks, CTR, and average position. Organic distribution in each country is different, so you need to look at the promotion of your content in each country. You can select a country on the filter, and the board will be filtered according to the indicators of this individual country. We can also see the number of requests, clicks, CTR, average position compared to the previous period, and details of these indicators for each type of device.
Then there is a table - the domains that we bought and that refer to us. When we published an article on this domain, it was already indexed, and Google saw that this domain links to us. You should see how many pages link to us. If there are many of them - this donor domain should be removed if possible. And if it is impossible to delete it, you need to write to TP-Link Google and say that we did not post this link. You also need to monitor indexing speed. We can see how long it took to index this domain. If it is more than 10, it is already a question of the feasibility of the invested money: if you bought a domain on the stock exchange, which was indexed in 20 days, this domain is not worth the money spent.
Behavioral factors
Behavioral factors show how a user behaves on your site on a specific page.
The lower the bounce rate, the better the behavioral factors. The minimum scroll should be 70%, and the time spent on the page should be at least 2 minutes. Then Google will consider your content relevant. If not, even with a good link profile, the site will not be at the top. That is why online calculators and various interactives are invented for sites so that the user stays on the page as long as possible.
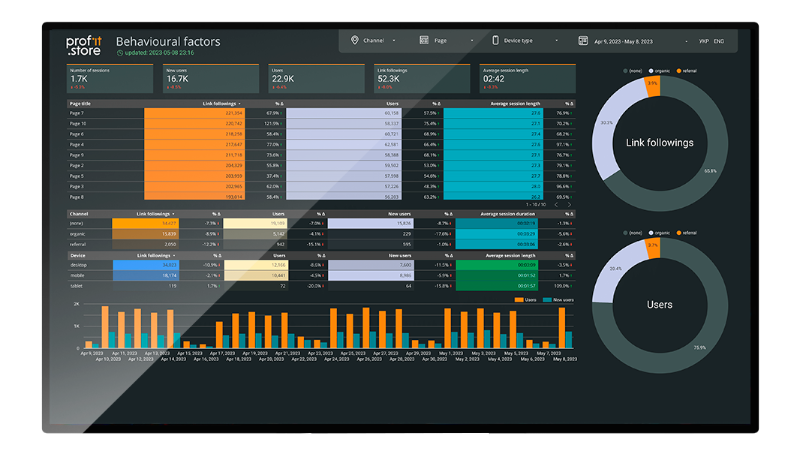
The dashboard displays the names of pages from Google Analytics, the number of conversions to the page, the number of users, the average length of the session, and the delta for each indicator. We see if conversions are growing, how many users there are, and how much time they spend on the page on average. There are direct links to the site: they show the number of users, new users, and the average session length.
We see organic traffic - SEO: entered a key query, went to the site, and there will be organics. There is also a referral. These are transitions from sites that I refer to you. For example, you have placed an article in the media, and you will always see new users moving from it to your site. If there is a hacker attack, the referral will be distributed to specific sites from which this traffic comes. Then for a specific site, you can write a statement to Google Search Console so that this traffic is filtered and disabled. We duplicate all of these metrics in pie charts and generate a retrospective analysis of users and new users on the site, in general, to see which audience is using the site, which is our customer base, and which new users are also coming.
On the dashboard, there is detail in devices (mobile, desktop, tablet): number of transitions, users, new users, and average session length.
The following dashboard is handy for you if the company has branches worldwide: just hover over any branch and see the number of conversions received and the number of users. And so for every branch anywhere in the world. You can advance with SEO all over the world and see on the map all the places where there are purchases, user appeals, new users - all the activity. Full synchronization with Google Maps, Google Ads, Google Search Console, and Google My Business.
Now you know why I call SEO an art. It consists in always keeping a balance: buying links in such a way as to calculate everything in terms of indexing speed, monitoring bugs, adaptability, and fast loading of pages.
Here I must also emphasize that Google does not like SEO content anymore. The content should be interesting, useful, and generally reader-friendly. Without this, the site will not have top positions, it will not be possible to get into the first 5 with an SEO article. Also, the speed of loading (rendering) pages on a specific device and the adaptability of pages for mobile devices affect the domain's trust because the traffic is mostly mobile users. If there is no optimization and speed, there will be no top positions either.
SHARE

OTHER ARTICLES BY THIS AUTHOR
Get the most exciting news first!
Expert articles, interviews with entrepreneurs and CEOs, research, analytics, and service reviews: be up to date with business and technology news and trends. Subscribe to the newsletter!
By clicking “Subscribe” you agree to Privacy Policy and consent using your contact data for newsletter purposes
OR FOLLOW ON:
