


Marketing analytics

TABLE OF CONTENTS
Profit.Store

908
- Which channel brings me the most customers?
- Which channel do the cheapest customers come from?
- How to distinguish an effective marketer from an ineffective one?
- Is my advertising budget correct, or should it be increased or decreased?
- optimized?
- Why is the lead price constantly increasing?
- Why is business growing and profits falling?
- Which employees are efficient and which are not?
- What time of the call is most effective for sales?
- How to switch to planning?
- How to deal with a cash gap?
- How to forecast key business indicators and profits?
These and many other questions can be answered by an analytical system designed for the needs of your business.
Let's dive into the details.
- The company has a website or several.
- It does advertising activities in various communication channels with direct purchase of advertising traffic and/or organic channels such as SEO, ORM, and SMM.
- It has several in-house marketers responsible for certain channels and outsourced agencies or freelancers working remotely.
- It also has sales and customer service managers on board.
It seems like a completely standard set, but how to understand the effectiveness of each link of the funnel - from advertising to payment?
⠀⠀
Analytics efficiency factors
1. Connection of basic analytical systems, such as Google Analytics, Facebook Pixel, Hotjar.
Due to these services, you can receive information about the interaction of users with the site, being able to optimize and increase the effectiveness of advertising campaigns and getting details on the audience you interact with.
2. Agreement cycle.
This affects the correct calculation of advertising efficiency. Most companies count exclusively on the reporting period - how much they spent and how much they earned, and this almost always does not show the real picture of marketing efficiency.
Let's simulate a real situation. Lead generation costs took place 2 months ago, the activities involving organic traffic happened in the following months, and the deal cycle was 1 month. If efficiency is measured by the reporting period, then the most efficient month is the last one, and it will receive all the benefits, while the previous month and the current one will be considered ineffective in terms of the amount of money in the cash register. Now let's analyze in more detail: the expenses occurred, we didn't get a quick profit, we decided to change the channels or task executors or all at once - and a month later, we got the result, we were happy, and the budgets increased, but the profit fell, not grown, as you had predicted. It turned out that the deal cycle had delayed the profit by a month. Therefore, the correct model for calculating the effectiveness of advertising is a slightly more complex system, namely with a link to the deal cycle. Then the money will be accrued cumulatively on the date of expenses for the leads converted into successful deals.
3. UTM tags.
There is a standard method of marking traffic when parameters with information about advertising activity are added to the link, for example, profit.store?utm_source=facebook_ps&utm_medium=lenta_fb&utm_campaign=campaign_name&utm_content=group_name&utm_term=advert_name|creative_name.
These parameters are called UTM tags. Using the above example, let’s analyze them further: utm_source – the traffic channel is indicated, in our case, it is Facebook, and the value that stands before _ is the identifier of the contractor, agency or in-house specialist to understand who exactly brought the lead, client, money. utm_medium – indicates the place where the ad will be displayed, namely the Facebook feed. utm_campaign – here, we specify the name of the advertising campaign. utm_content – here is the name of the ad group. utm_term – and here we indicate the name of the ad itself, and through | we specify the name of the advertising banner to understand which promos are effective and to what extent.
Channels such as Facebook Ads, Google Ads, and Tik-Tok can set most of the above parameters themselves, you only need to specify the value track parameters, which greatly facilitates the process of traffic marking. There are also convenient UTM tag builders that will do everything for you -OUR UTM BUILDER. According to the given example, you need to mark all traffic channels and all advertising links, wherever you publish them. Then you will always understand the effectiveness of each action in marketing.
4. CRM system.
It is very important to have a system for accounting for leads, applications, deals, customers, and money. This is extremely important for building an analytical system, because it will record all those UTM tags, by which the algorithm will search for correspondence on advertising channels and calculate performance indicators.
5. Lead-scoring.
The synergy between marketing and sales is important. This will help to quickly adjust advertising activities for more effective marketing investments. The classic scheme is when a lead quality assessment scale is introduced, the sales department reports daily on the quality of processed leads so that the marketing draws conclusions and makes appropriate adjustments to ad campaigns.
6. Keep track of all expenses systematically.
To calculate return on investment indicators, such as ROMI and ROI, you need to have all costs, not just direct from advertising offices. Then all calculations will be correct, and the indicators will be representative. Therefore, all direct and indirect costs must be kept at least in Excel tables. As an example, here is our template - Expenses table . This was the minimum set to calculate metrics such as LAC - Lead Acquisition Cost, LAQC - Qualified Lead Acquisition Cost, SQL Qualified Leads Transferred to Sales, CAC - Customer Acquisition Cost, ROAS - Return on Advertising, ROMI - Return on Marketing Investment, CLTV - customer lifetime value.
Having fulfilled all the basic needs, it is necessary to collect data from all sources, and automate import and export with the required frequency so that the analytics are always relevant, transform and clean so that it is possible to compare the data of expenses with income and visualize all calculated indicators on convenient dashboards. This process is called ETL, and it is the basis of analytical systems.
⠀⠀ ⠀⠀
Analytics tools to help you manage your business effectively
If you compare business with the human body, there is a lot in common, both in functioning and in care, examination, and treatment.
When the first symptoms appear, you already understand what to expect and when. It's the same in business: by analyzing the dynamics of key performance indicators, you clearly understand where you are heading - in the cash gap or profit.
Quite often, when the first symptoms appear, we think that it is not serious and will pass soon, and as a result, we spend 2 weeks with the flu. It's the same in business: missed the problem a bit - and hello, cash gap.
Of course, you feel your body better, because it has its own system for assessing the condition. But a business needs a clear system for collecting telemetry and displaying the health level of each process. Like it happens when you pass tests in a hospital, to understand what happened, what will happen next, and how to treat it.
Therefore, I strongly recommend not to start treatment when things already go completely wrong, but to prevent primary symptoms. They can be seen by the performance of planned indicators at the very beginning of advertising activities.
It is necessary to manage the health of the body/business regularly. And for this, you need a tool.
Let's break down marketing processes into details and understand what and when to pay attention to so that the body is healthy and its owner happy.
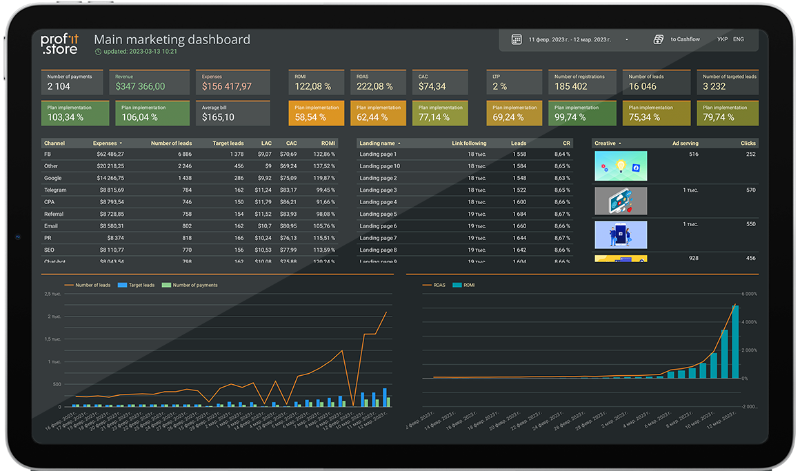
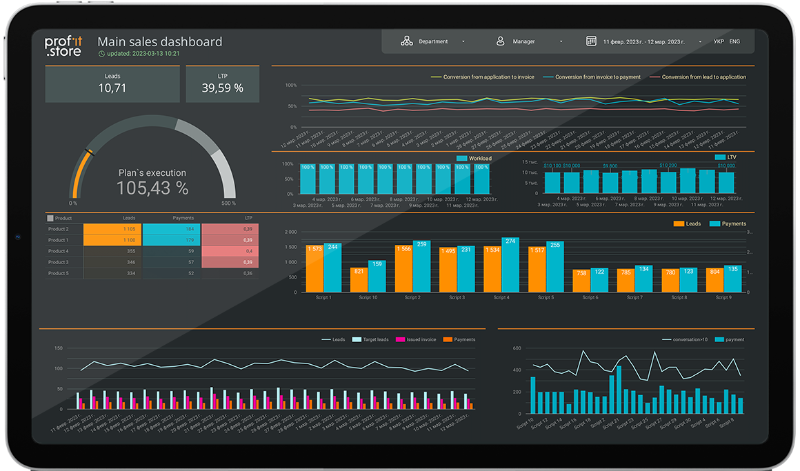
In all traffic channels, it is important to see the cost per acquisition of a lead, qualified lead, customer, and return on investment. These indicators clearly show which channel brings money and which simply eats it. Already having only this information, it is possible to make managerial, and operational decisions - what to turn off and what to scale.
Next, it's critical to know how sites and landing pages are converting, and make quick decisions about landing pages by evaluating the number of leads from your total traffic.
If you dig even deeper, you need to measure the effectiveness of promos that people see as your ad. Promos tend to burn out, be irrelevant, bring many leads and few customers, or few leads but more customers. And it is desirable, of course, to see the main indicators: total costs, value of the lead and customer, conversion to payment, return on advertising, return on investment, what share was marketing costs, average check, repeat sales.
At the same time, it is important to see not just indicators, but what percentage of the plan they already make up and within what limits your unit economy is. All this is on the dashboard above. This is the main marketing dashboard.
Plan tables - we provide our plan table template.
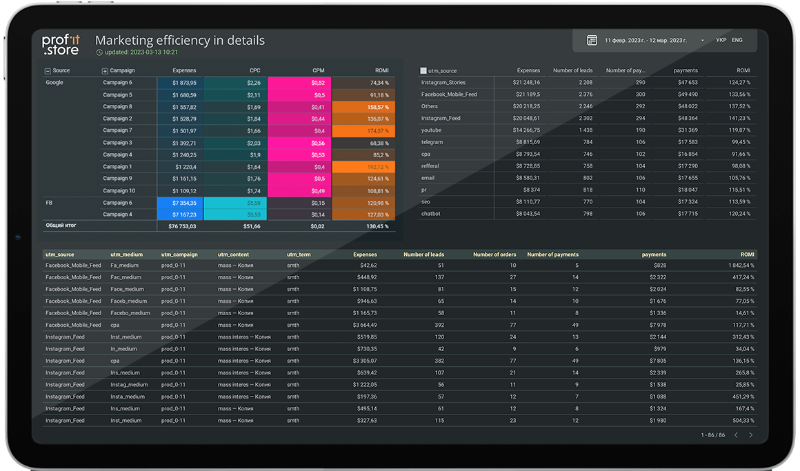
A general understanding of health helps in quick decision-making. However, germs or bacteria can sit deep, and to detect them, it is necessary to decompose all activities and actions in marketing as much as possible. This is where the traffic efficiency dashboard will come in handy.
The dashboard contains the most data. The left part is advertising cabinets, and the right part is organic. The lower part is a funnel of performance indicators for this activity. Everything is loaded according to the matrix: sources, advertising campaigns, and ad groups, which are deployed depending on the channels. That is, you can choose any ad, according to which the system will extract data from the database and upload it to the lower table. There we select all the indicators that we need to investigate. You can even see the LTV of each ad. All this allows you to study the effectiveness of all objects of marketing activity.
Another interesting fact is that the data is displayed in the usual format and corresponding names to all advertising cabinets you use. And as for organic traffic, the structure is displayed by UTM tags. Now no activity will remain without close attention - whether it is a letter to the database, or a letter from partners, or a blogger's recommendation, or a pdf presentation, or a flyer from an exhibition, etc.
With the help of the dashboard, you can investigate the origin of this very "virus": how it got into the body of your business and what processes it started.
To investigate the ways of obtaining "virus infection", you need to have a tool that shows the entire history of interaction.
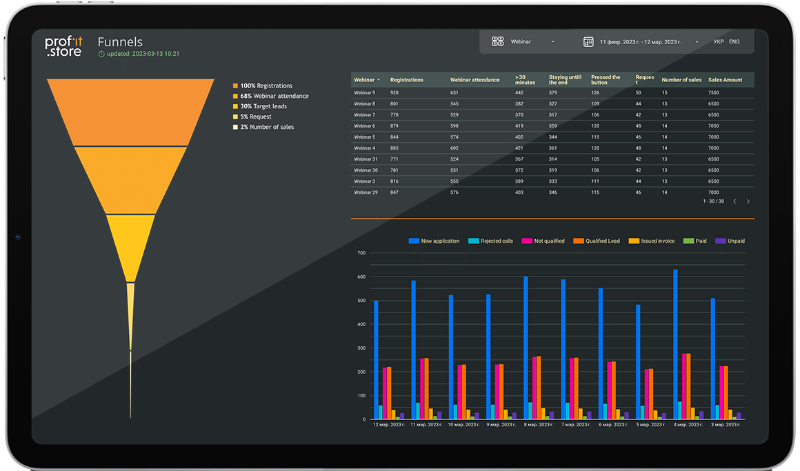
There is a general funnel on the dashboard - from advertising to payment. If it's a webinar, we have the number of registrations, the number of people who got to the webinar, how many of them were there until the end, how many of them clicked on the button, how many applications and sales there were, how much money was generated in the end.
There is also a funnel from the CRM system with statuses. How it works: the main funnel is filtered by the data of a specific webinar or product/service and shows the data in the section of the selected object.
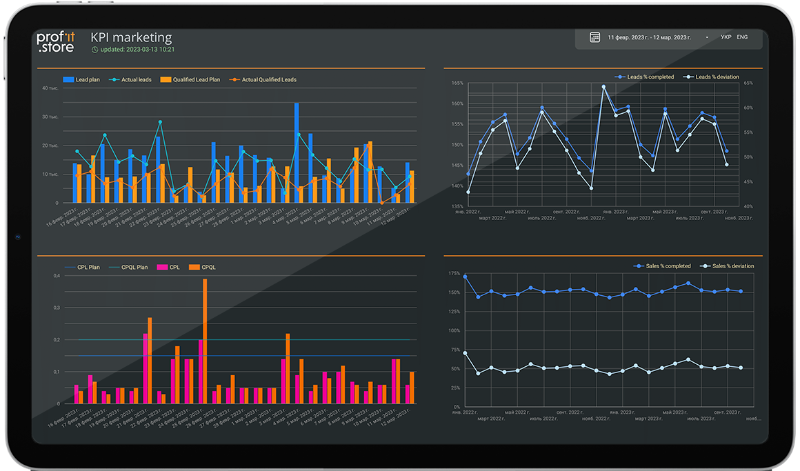
As not everyone knows, marketing is responsible for the following indicators: the number of leads and the cost of leads. Further, with team synergy, it can also be responsible for the number and value of target leads.
The dashboard has four graphs that allow you to track the plan/fact from leads and qualified leads.
To display the plan/actual indicators, the system imports from CRM all estimates made by the sales department. The schedule has a percentage of completion and a deviation coefficient.
And the cherry on top in this block of research into the health and efficiency of the great business machine is the money dashboard. Here is a full breakdown of what happens after the lead gets into the SRM system.
You can simply look at the efficiency of the department in general, or you can focus the microscope on a specific manager and see his implementation of the plan in % and money, in conversions from lead to account, or from account to payment, see the entire product matrix by quantity processed leads and sales for a specific product or service, see his load, how he upsells to existing customers, what is the most effective conversation time, how he works with scripts, and find out his performance in comparison with other managers.
⠀⠀ ⠀⠀
Conclusion
In conclusion, I would say: it is important to make management decisions based on solid data, in which you are 100% sure. Then the body will be healthy, and the business will be profitable!
⠀⠀ ⠀⠀
Bonus, FAQs
Which channel brings me the most customers?
You have no idea how things like last and first click affect this. It turned out that simply putting UTM labels is not enough, you still need to understand whether they are overwritten in the CRM system.
Which channel do the cheapest customers come from?
It is a discovery for me! I have always considered it necessary to scale contextual and targeted advertising as much as possible, and it turned out that media posts have the highest ROMI. From the point of view of the unit economy and common sense, it is correct to scale this channel.
How to distinguish an effective marketer from an ineffective one?
They will tell you about their expertise, and then spend the budget inefficiently. And that's the case with everyone I've worked with: - Everything is fine, the leads are on their way.
- But the lead is unqualified, and the price is high.
- Everything is going right.
So here it is: -_ utm labels_
- correct attribution
- understanding the deal cycle
- lead-scoring and control of such “experts” - and not a single wasted dollar.
Is my advertising budget correct, or should it be increased, decreased or optimized?
"For example, if I invest in targeting + 1k dollars, I will earn more", - I thought. Well, I invested - and what do you think? The lead cost has increased, Qualifications and sales decreased. And it turns out that you need to monitor the growth of budgets by more than 20% because all the optimization goes wrong.
Why is the lead price constantly increasing?
And it's even funny, at least now. I use the target and put the whole budget into it. Who wouldn't want to make money from that?
Diversification every month + 1 channel and a test of advertising activities in it - we find what works and scale it. And so every month. And you will forget about the rising lead cost.
Why is business growing and profits falling?
A classic, scaling damage. First, we build a unit economy, clearly digitize all processes for tracking the plan, and only then scale it up.
Which employees are efficient and which are not?
You can easily answer this question in your companies by digitizing KPIs. One dashboard per department with KPI dynamics - and they will start competing with each other.
What time of the call is most effective for sales?
But seriously, is 8 minutes or 30 minutes better for processing lead? No one knows, until he builds a system for tracking the effectiveness of all calls in the section manager, script, conversation duration. Digitize and see!
How to switch to planning?
A difficult question, it would seem, but no - not at all! We know how much money there is or how much we can get, we calculate retrospective conversions from a lead to payment, we calculate how much we can earn, and we divide it by the number of leads, and customers. And you know what? You are already planning. Is it really easy? And if you digitize and build a dashboard, it will do for you.
How to deal with a cash gap?
And it is better to fight not with him, but with everything that comes out: the lead went beyond the edges, but the conversion did not increase - immediately wait for the gap; sales conversion has decreased - wait for the gap. And it would also be nice to use a payment calendar so that some unexpected super-important payments do not ruin the business.
How to forecast key business indicators and profits?
Here, my friends is the main conclusion of our meeting today. Collect as much data as possible, control their correctness, build an analytical system for analysis, and forecast indicators retrospectively by analyzing the influence of all known factors.
SHARE

OTHER ARTICLES BY THIS AUTHOR
Get the most exciting news first!
Expert articles, interviews with entrepreneurs and CEOs, research, analytics, and service reviews: be up to date with business and technology news and trends. Subscribe to the newsletter!
By clicking “Subscribe” you agree to Privacy Policy and consent using your contact data for newsletter purposes
OR FOLLOW ON:
