


What is Power BI: overview and how to use it

TABLE OF CONTENTS
Profit.Store

34
This business intelligence tool developed by Microsoft opens up many possibilities for creating working dashboards based on data from different sources.
Power BI is a tool for analysing and visualising data in a business environment. This means that it can be used not only to understand the information provided by data, but also to present it easily and effectively in the form of graphs, charts and other visual elements.
Power BI allows us to work with a wide variety of data sources. We can import data from databases, cloud services, web services and even files. This means we have complete control over the data we need to analyse and visualise.
Power BI also gives us a wide range of ways to work with data. We can import, manipulate, visualise and collaborate on data. This makes Power BI a complete platform that helps us manage the lifecycle of data, from collecting it to sharing it with other users.
Power BI is our key to understanding and using data in business. Let me walk you through all the key features and capabilities of Power BI so you can see its power and the benefits it can bring to our business.
Integrated data import and processing
Power Query is a query that an analyst can create with the click of a mouse, telling the system where to go and what actions to take. It is very similar to macros. Only the commands are written in M and are more like Excel formulas: they also have a function name and arguments in brackets. Power Query doesn't require any programming knowledge or skills: the M code is generated automatically. With a few simple mouse clicks, you can work wonders and solve almost any problem. Sometimes, however, the query needs to be corrected. And even less often, you need to write it completely manually. This tool is widely used for advanced business analysis and is designed to connect to and transform data sources.
Although you can load data into Excel using the Power Pivot tools, the transformation options and available data sources in Power Query are much richer and easier to work with. You don't need complex formulas and macros to manipulate tables and link to data.
Power Query can do the following
- directly connect to data from various sources;
- clean up data and perform conversions;
- upload prepared data.
Thus, Power Query is a full-fledged ETL tool (Extract, Transform, Load).
One of the most important features of Power BI is its built-in data processing capabilities.
Advanced data processing capabilities:
- Power BI provides an M query language that allows you to perform complex data transformations and calculations.
- You can write custom expressions, add conditional statements, apply aggregation functions and perform other data manipulations.
- Power BI also supports the DAX (Data Analysis Expressions) language for creation.
Connect to data sources
Power BI offers a wide variety of data sources, including databases (e.g., SQL Server, Oracle), Excel files, cloud services (e.g., Azure SQL Database, SharePoint Online), websites, and more.
You can configure connection settings, including credentials, authentication options, and how data is updated (real-time updates, etc.).
Power BI also provides the ability to import data from local files, cloud storage (e.g. OneDrive, Dropbox), or use Power Query to connect directly to data sources.
Transform data
Power BI provides powerful data transformation tools, including filtering, sorting, grouping, deleting duplicates and merging tables. You can perform various data transformation operations, such as deleting columns, adding new columns based on formulas, converting data types, and cleansing data, or you can perform advanced functions. These functions include extracting data from structured text files, parsing JSON, separating columns based on delimiters, and more.
Data modelling
Power BI lets you create relationships between data tables to combine data from different sources. You can define relationships between tables using common columns and create hierarchies for easier data analysis. Power BI supports automatic relationship discovery and provides tools to manually define and modify relationships between tables.
Automate data updates
- Power BI allows you to set a schedule for updating data from sources.
- You can choose how often and when to update your data, so your reports and dashboards are always up to date.
- Power BI also supports automatic real-time data updates for specific types of data sources, such as data streams or API services.
Import Power BI data
Power BI has several ways to import data. Here are some of them:
- Import from data source files: You can import data directly from a variety of files, such as Excel files (.xlsx), text files (.csv, .txt), or JSON files. Power BI allows you to select and configure data sources and then import their contents.
- Connect to databases: Power BI supports connecting to several types of databases, including Microsoft SQL Server, Oracle, MySQL, PostgreSQL, and others. You can specify connection parameters, such as server address, credentials, and database name, to have Power BI connect to the database and import data.
- Connect to cloud services: Power BI is integrated with various cloud services such as Azure SQL Database, Azure Data Lake Storage, SharePoint Online, Salesforce, and many others. You can use the credentials and connection settings of these services to import data into Power BI.
- Import data from services and applications: Power BI offers integration with many services and applications, including SharePoint, Dynamics 365, Google Analytics, Salesforce, and more. You can use the appropriate connectors and configure connection settings to import data from these services into Power BI.
Scrapers in Power BI
With the exception of Power Query, Power BI no longer has scrapers built in. However, you can use external tools and services to extract data from websites and integrate it with Power BI.
Some popular data scraping tools that can be used with Power BI include
- Python and R scripts: Power BI supports running Python and R scripts, so you can use them to scrape data from websites. You can write your own scripts using libraries such as BeautifulSoup or Selenium to extract data. You can then import this data into Power BI for further analysis and visualisation.
- Third-party extensions: Power BI has an extension store where third-party developers can provide integrations with external services and tools, including those that can provide data scraping capabilities. You can explore the available extensions in the Power BI store and install the ones that meet your data scraping needs.
It is important to note that if you use data scraping from websites, you must comply with copyright, data use, and privacy laws.
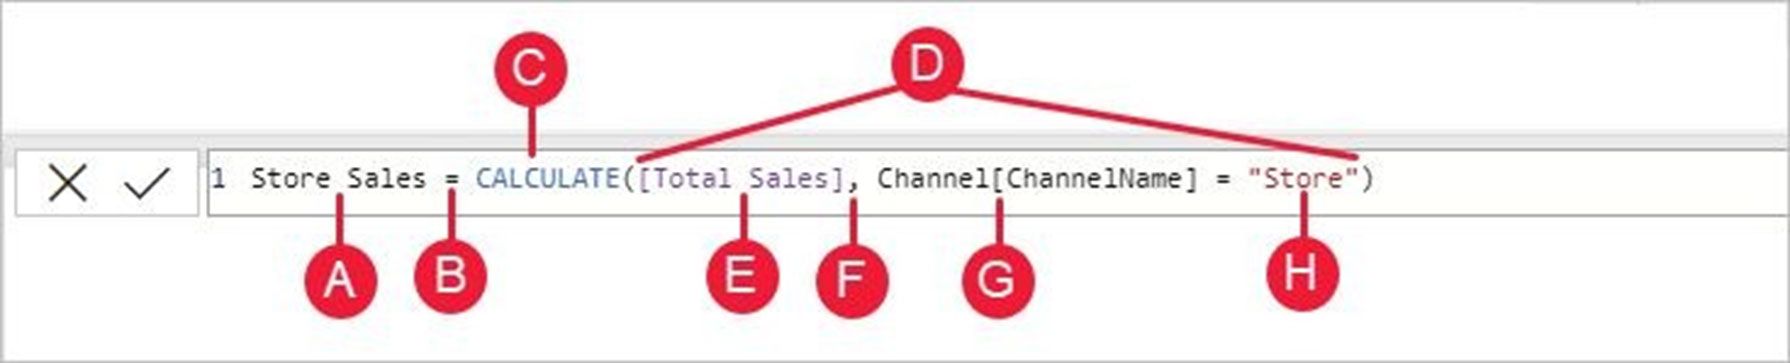
DAX or Data Analysis Expressions programming language
DAX, or Data Analysis Expressions, is a programming language designed for working with data in Power BI and other Microsoft data analysis tools. It allows you to create formulas and expressions to calculate values, aggregate data, filter results, create conditional expressions, and more.
One of the key features of DAX is that it works with a relative data model. Instead of accessing a database directly, DAX works with a data model that includes tables, columns and relationships between them. This allows you to access data in the context of the model and perform calculations using information from different tables and columns.
DAX allows you to perform complex calculations such as aggregations, rankings, filtering and logical expressions. You can create new columns, calculation tables and measures that allow you to extract valuable analytical information from a data set. For example, you can calculate the amount of sales for a particular period using filters by date and product category, or compare sales results with the previous period to determine growth or decline.
DAX also supports a wide range of functions, including mathematical, statistical, string, logical, date and time, aggregation and many others. This gives you more flexibility and options for a wide range of data analysis and processing.
Using DAX, you can make sense of data, perform calculations and draw conclusions that affect your business planning and decision-making. Knowledge of DAX is a useful tool for data analysts to understand complex data and extract valuable information from it.
No-code and low-code systems in Power BI
No-code systems are tools that allow you to connect data sources, including Power BI, without programming. They provide a visual programming interface that allows users to create connections and configure data flows by dragging and dropping different components.
Although no-code and low-code platforms are similar, they have a significant difference: while no-code enables development without the use of code, low-code allows you to develop the basic concept of an algorithm, but you will need to configure its flexibility and other aspects using code.
There are several popular no-code and low-code systems on the market that can be used to connect data sources to Power BI. Some of them are: Supermetrics, Zapier, n8n and Make (integromat). Each of these systems has its own features and capabilities that make it attractive for different data connection scenarios.
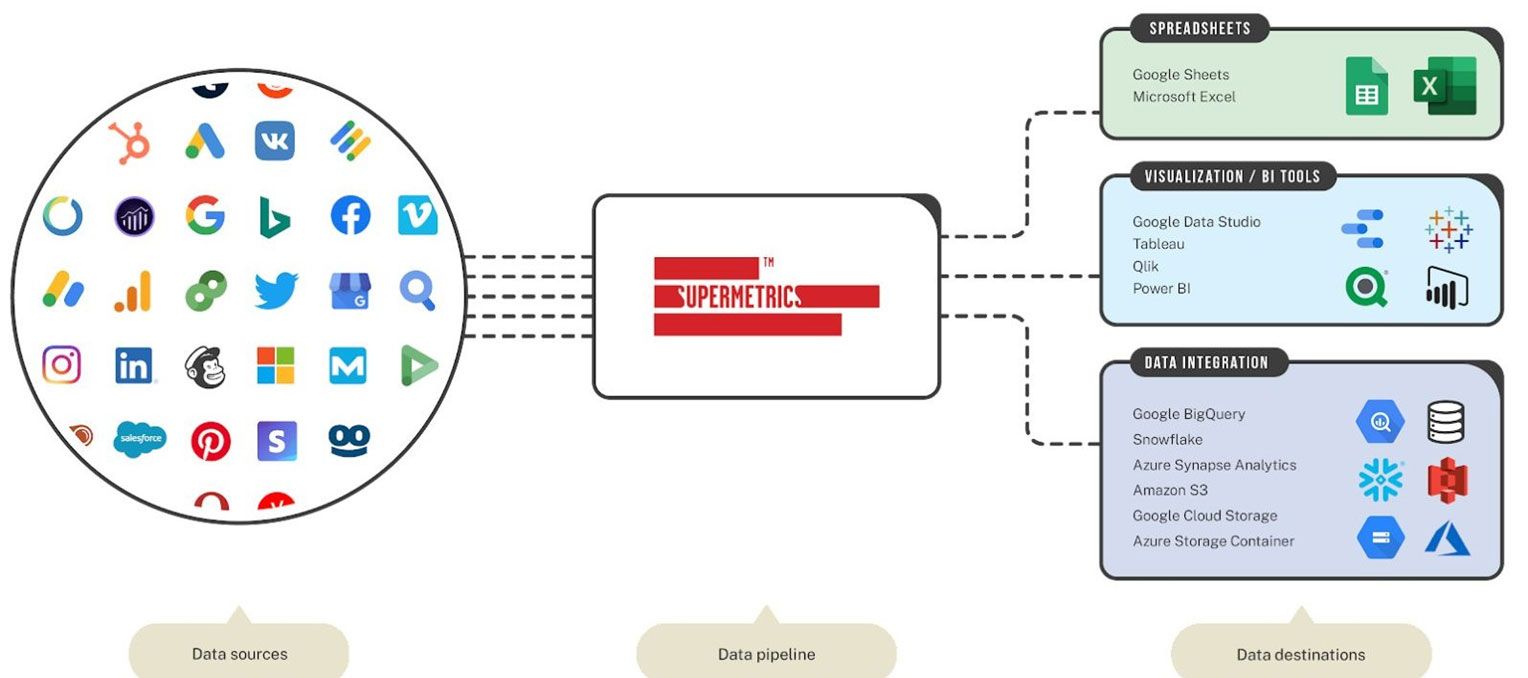
Supermetrics
Supermetrics is a data analysis tool that can be classified as a low-code system. Thanks to its intuitive interface and a wide range of pre-built connectors, Supermetrics allows you to easily and quickly collect, process and integrate data from different sources.
The platform provides the ability to automate data collection processes by creating connections between different sources and widgets in a single interface.
The main advantage of Supermetrics as a low-code system is its speed and ease of development. It allows analysts and data professionals to create complex dashboards and reports in less time, thanks to the visual part of the programming.
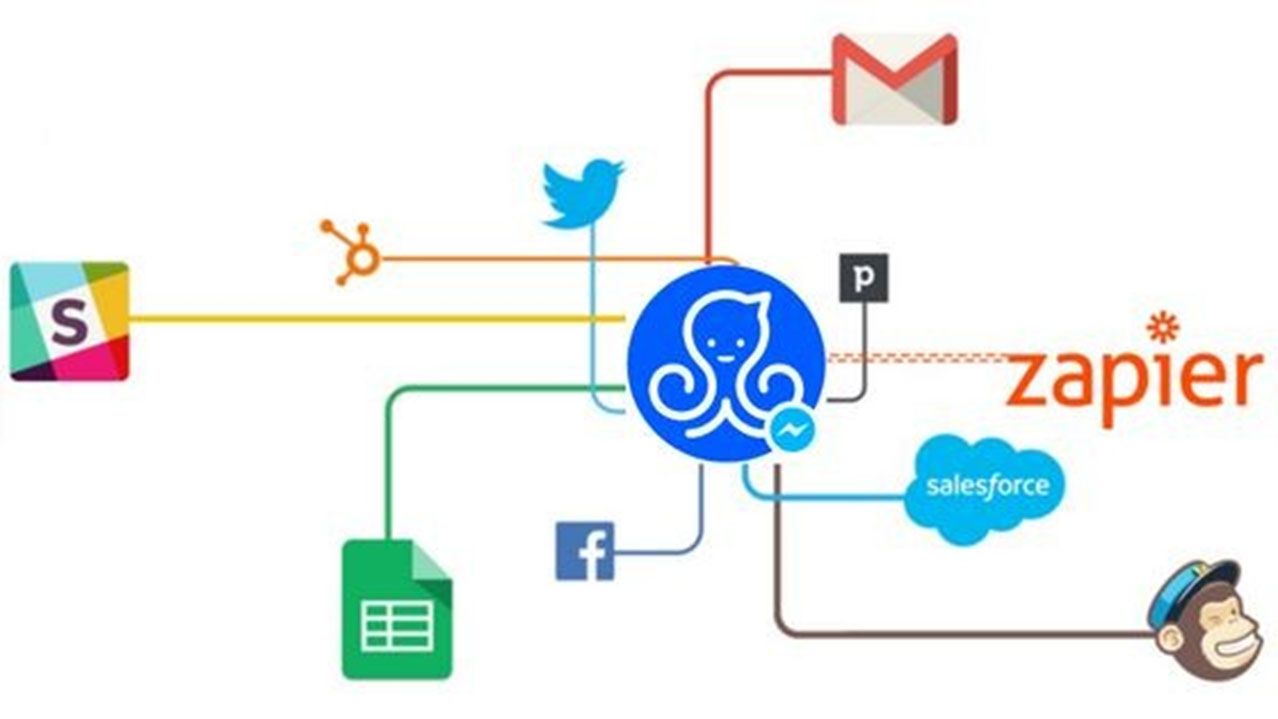
Zapier
Zapier is a no-code business process automation and data integration system. Zapier requests (Zaps) allow you to easily connect different applications and services and create automatic actions between them without the need for programming.
Using Zapier's visual interface, users can create connections between different applications by setting up triggers and actions to perform specific tasks automatically. There is no need to write any code as everything is configured in an easy-to-use visual environment. This system allows you to automate routine tasks, share data between different applications and increase productivity effortlessly.
Make (formerly Integromat)
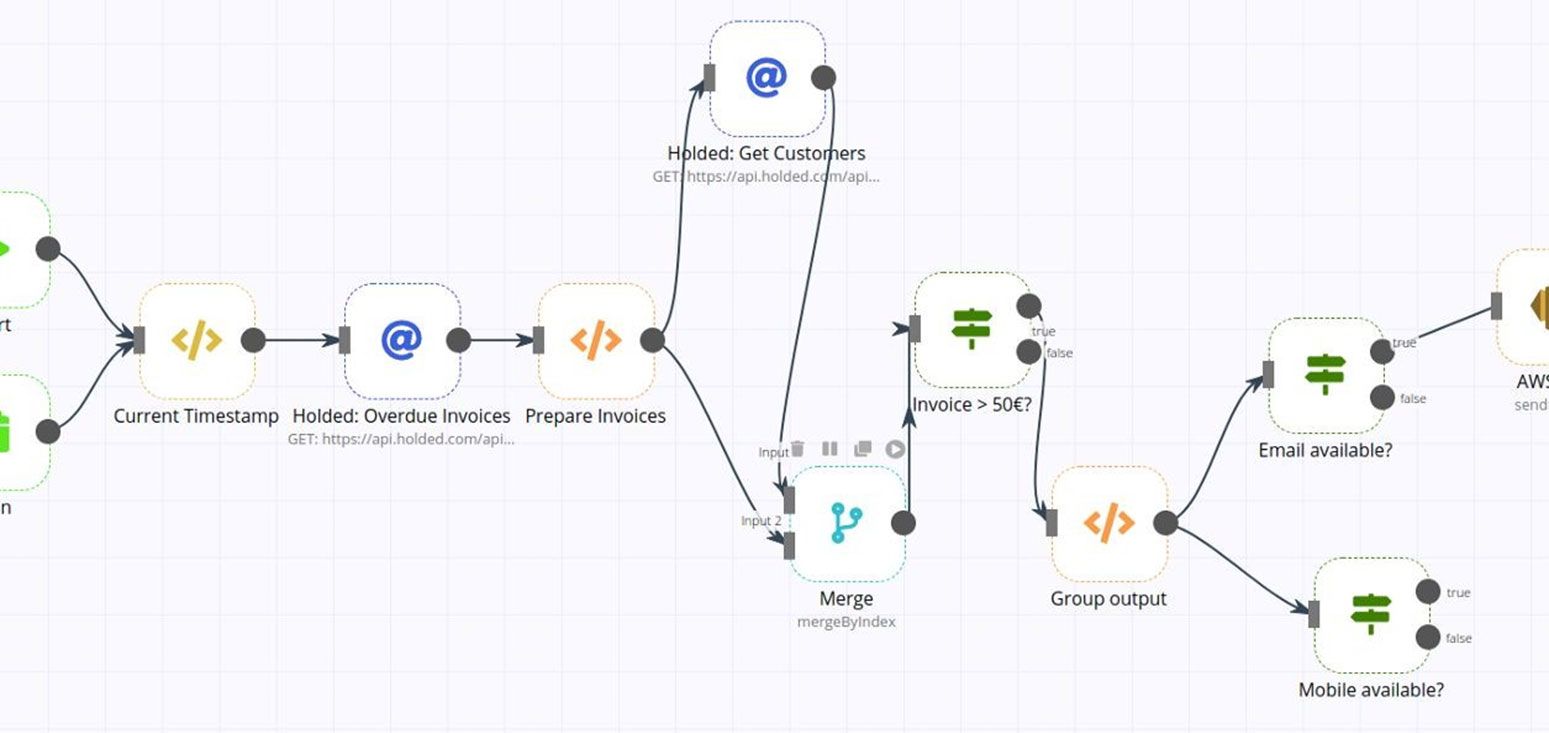
Make (formerly Integromat) is a no-code business process automation and data integration system. Thanks to its intuitive visual interface, users can easily create complex workflows by connecting different applications and services without programming.
Integromat offers many pre-built modules that can be easily configured and connected to automate routine tasks and share data. This allows users to make efficient use of their data, respond quickly to events and improve productivity without the need for programming. Integromat is the ideal choice for automating business processes without the complexity of programming.
n8n
n8n is a no-code data analysis and business process automation system. It allows users to easily create complex workflows and link multiple data sources and applications without programming skills.
Using a visual interface, users can drag and drop modules to create workflows, exchange data and perform automated actions. This allows users to quickly create and implement solutions without the need for programming, contributing to more efficient use of data and optimisation of business processes.
n8n (pronounced "en-ate-en") is a tool that allows you to connect any services and applications that have an API and set up data exchange between them without writing a single line of code.
It also helps you automate various routine processes and create your own complex backend services for different types of applications.
Characteristics of the n8n:
- The ability to install it on your server.
- Available for embedding in your own software.
- Extensibility (thanks to system applications or Node.js libraries).
The capabilities and logic of n8n are very similar to those found in most modern automation tools, such as IFTTT, Integromat, Zapier, Node-RED, Parabola, Bubble, Glide and other services with the ability to create scripts.
Each project in n8n is a workflow in which you connect different tools/modules/nodes. Each scenario you create is a program that sequentially performs certain actions on data within individual modules.
Globally, all modules within the n8n fall into 2 main categories:
- Triggers - activate the scenario when certain conditions occur.
- Regular - perform a series of special functions throughout the scenario.
Key features of n8n that competitors do not have:
- The ability to install on your own server. This can be important for corporate customers who do not want to transfer data to the cloud.
- Lower costs: you only pay for hosting if you install it on your own server or, in the case of the cloud version, you pay for chain launches regardless of their length.
- Great opportunities to expand the service.
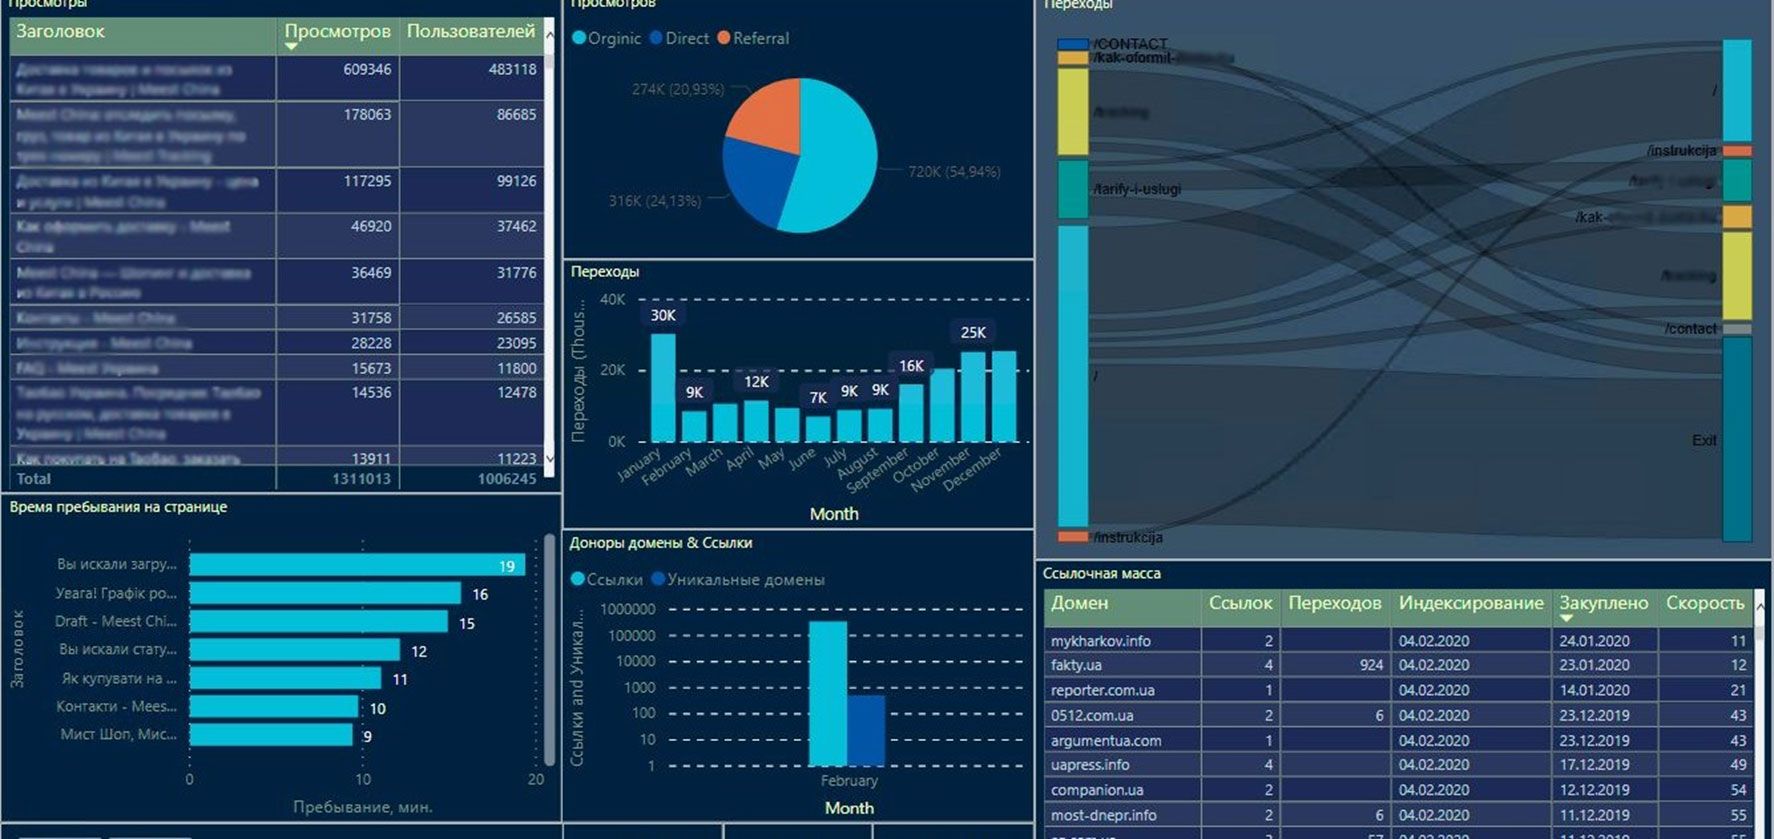
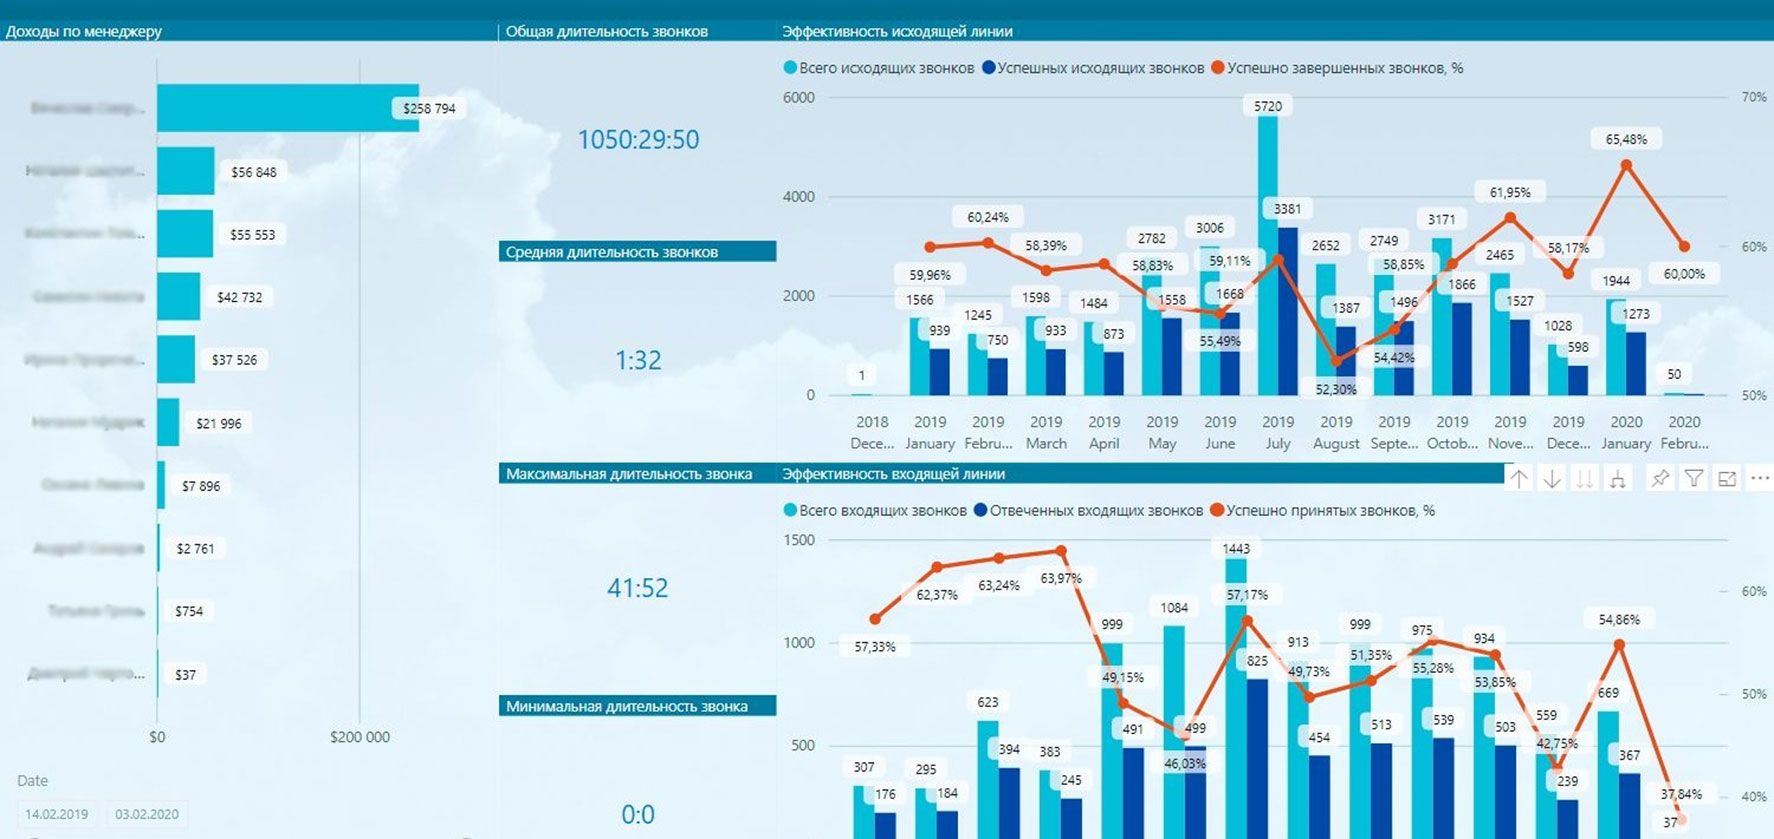
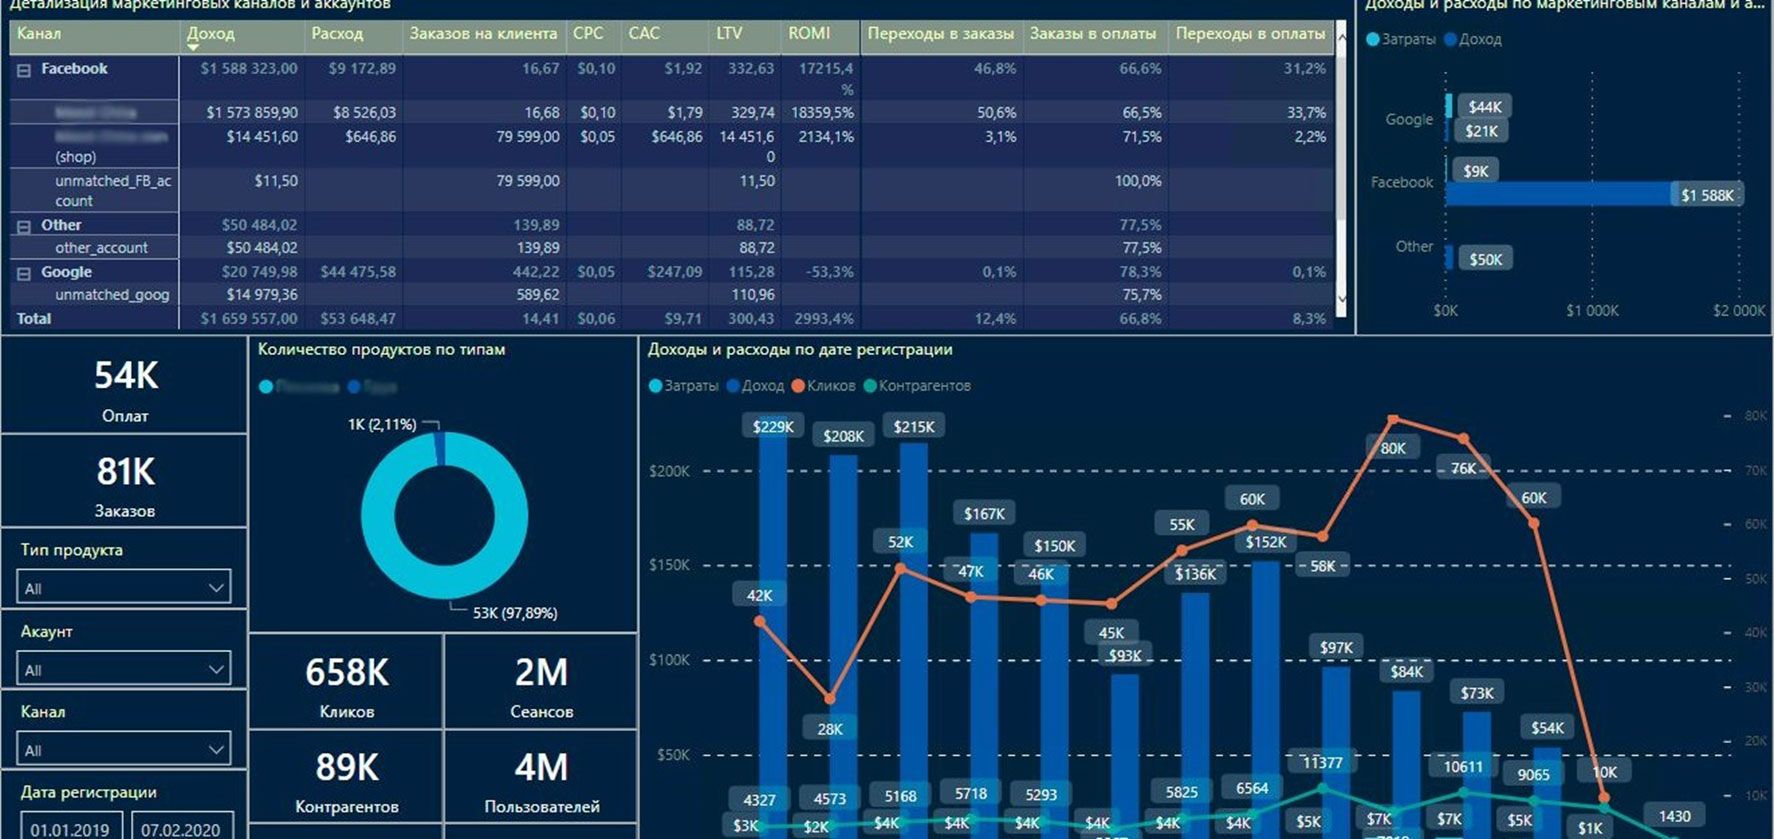
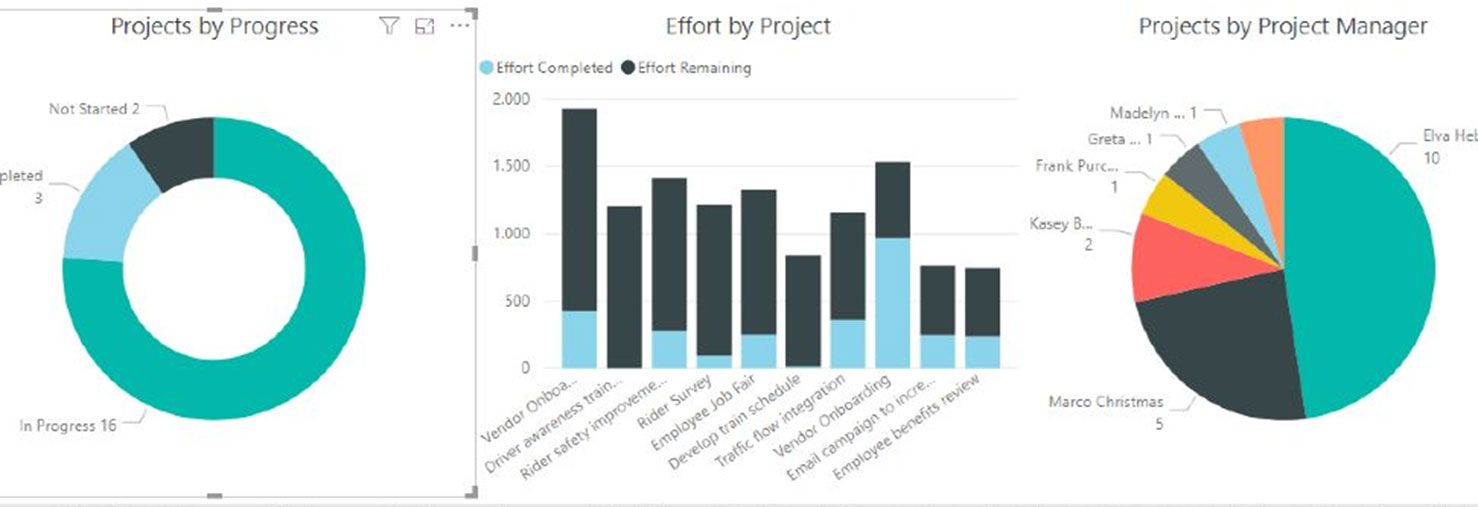
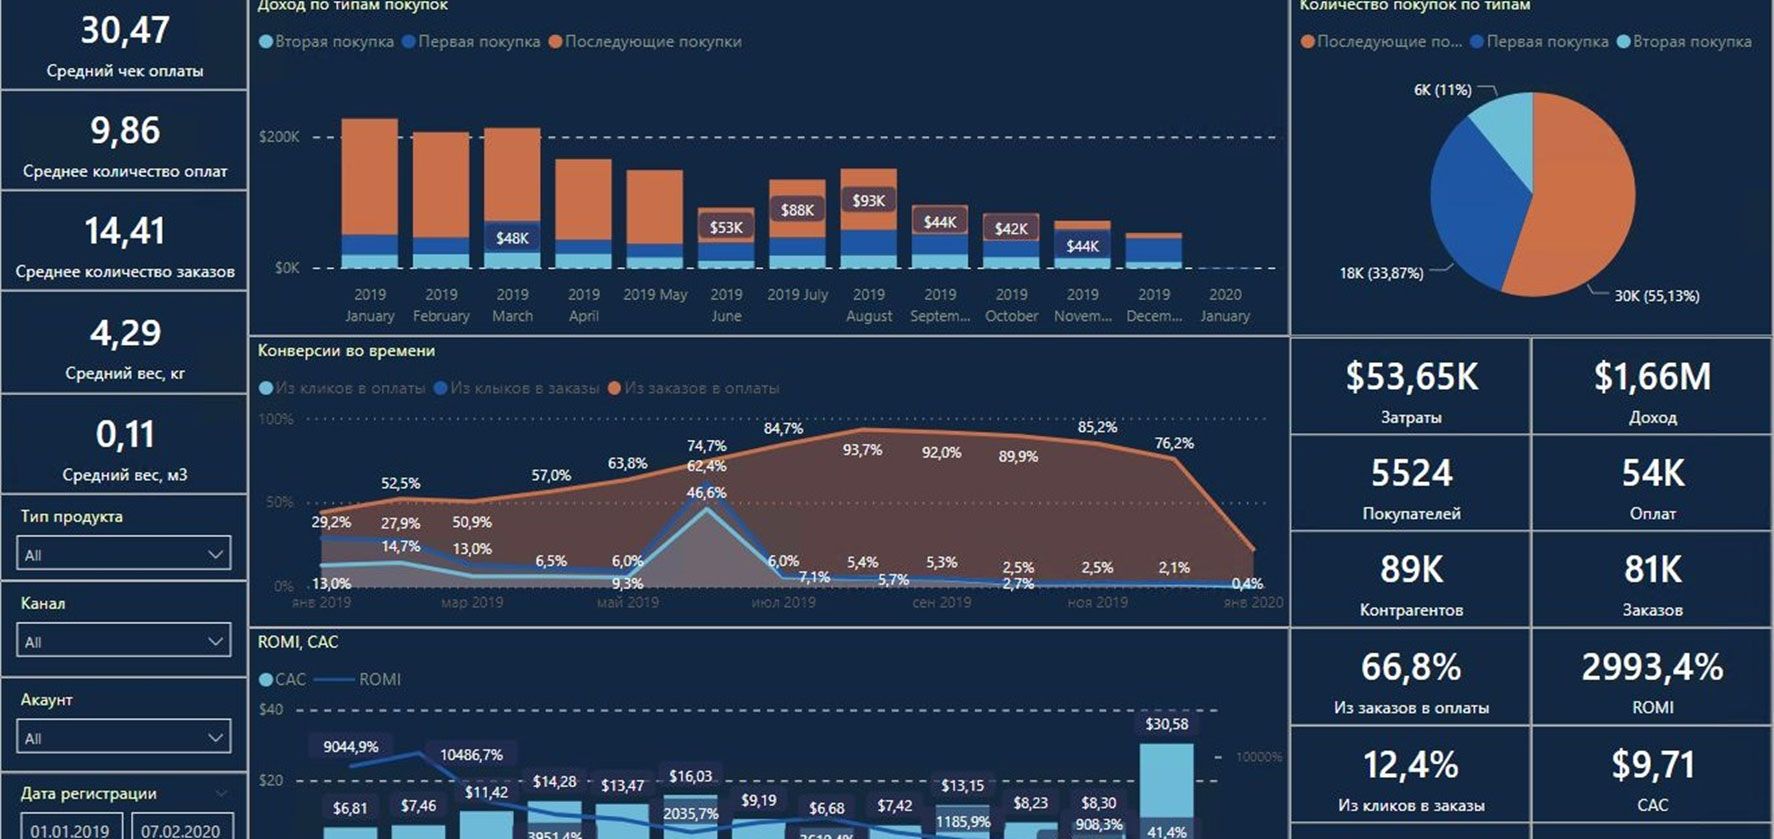
A range of built-in visualisations in Power BI
Power BI offers a very wide range of built-in visualisations, including
- Charts - including line and bar charts, area charts, combo charts, ring and pie charts, funnel charts, indicator charts, ribbon charts, dot charts, tree charts and cascade charts.
- Key performance indicators.
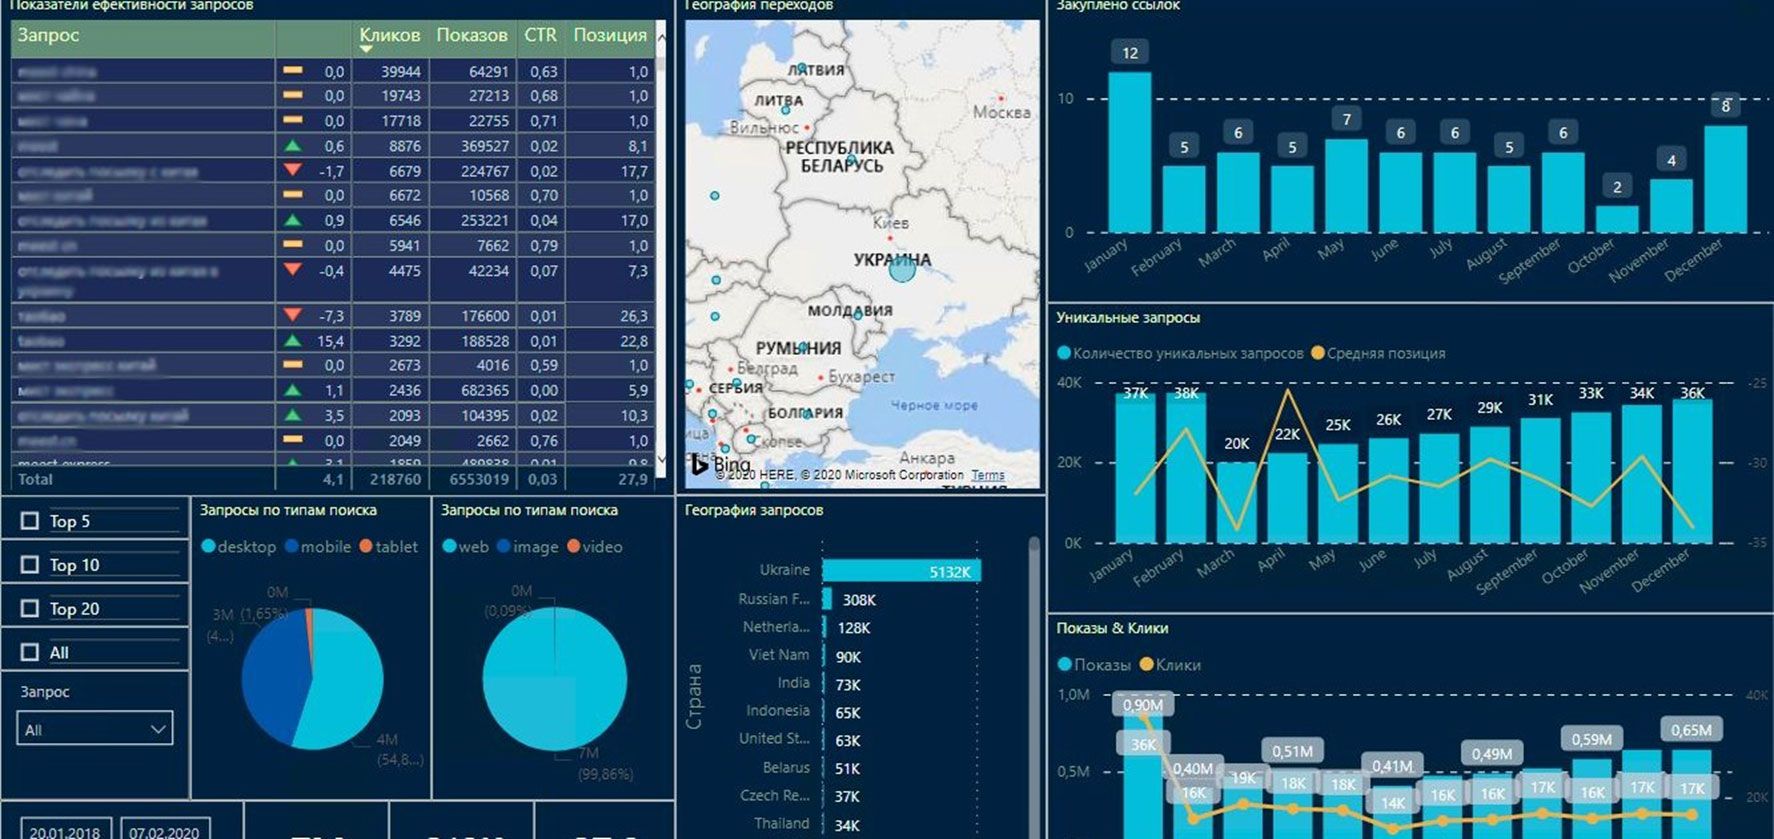
- Maps - base map, ArcGIS map, Azure map, shape map.
- Schedules.
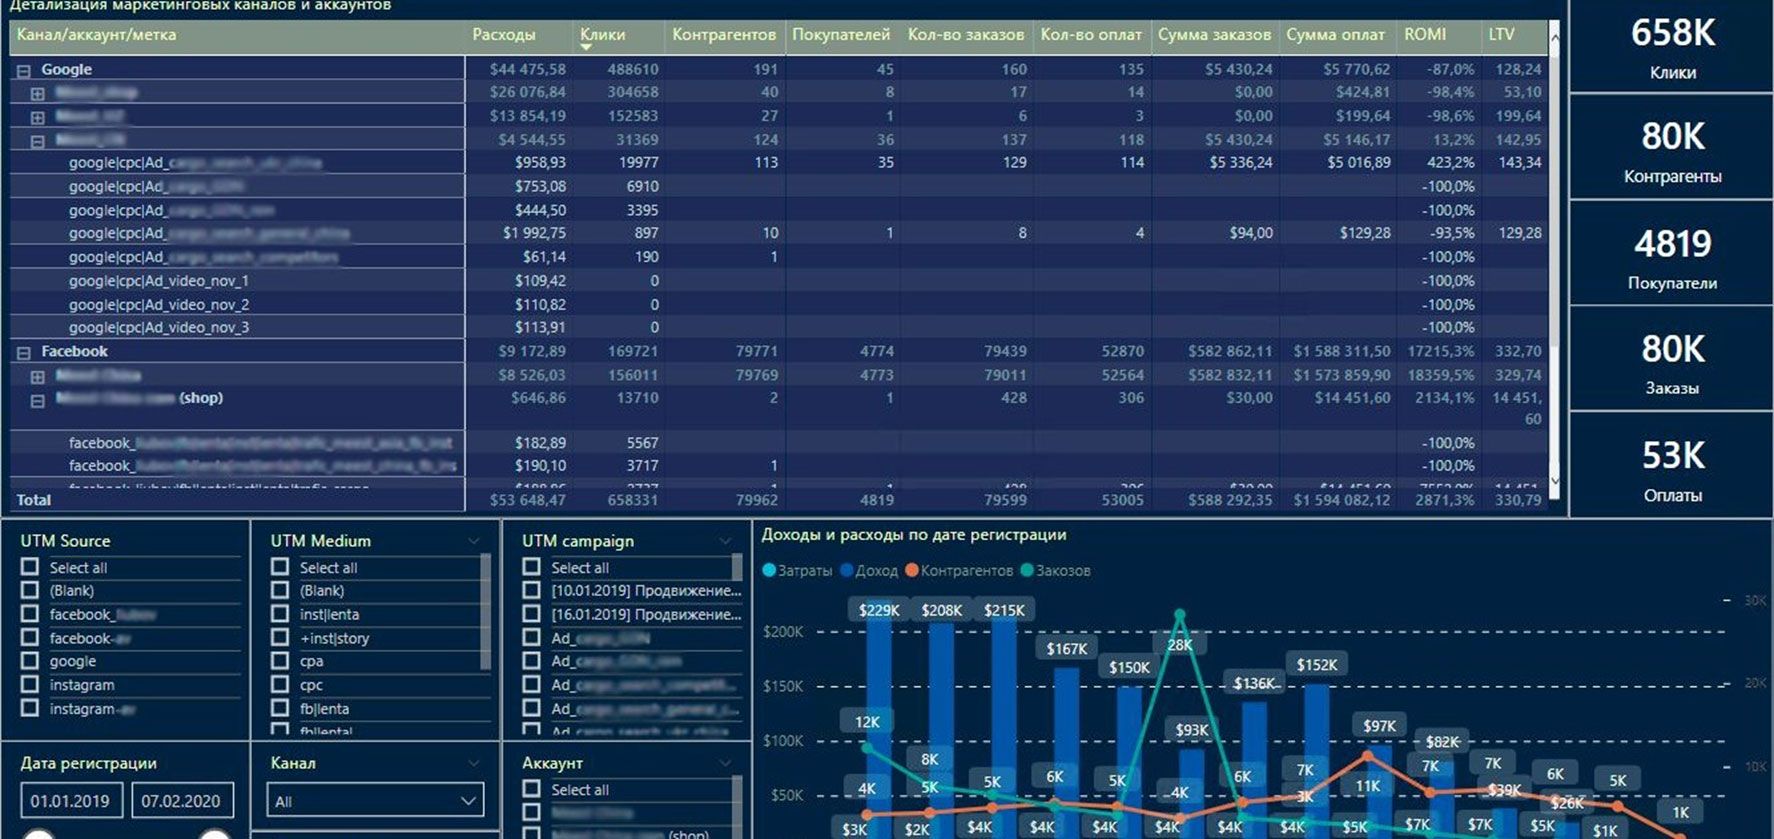
- Tables.
- Slices.
- Cards.
- Standalone images.
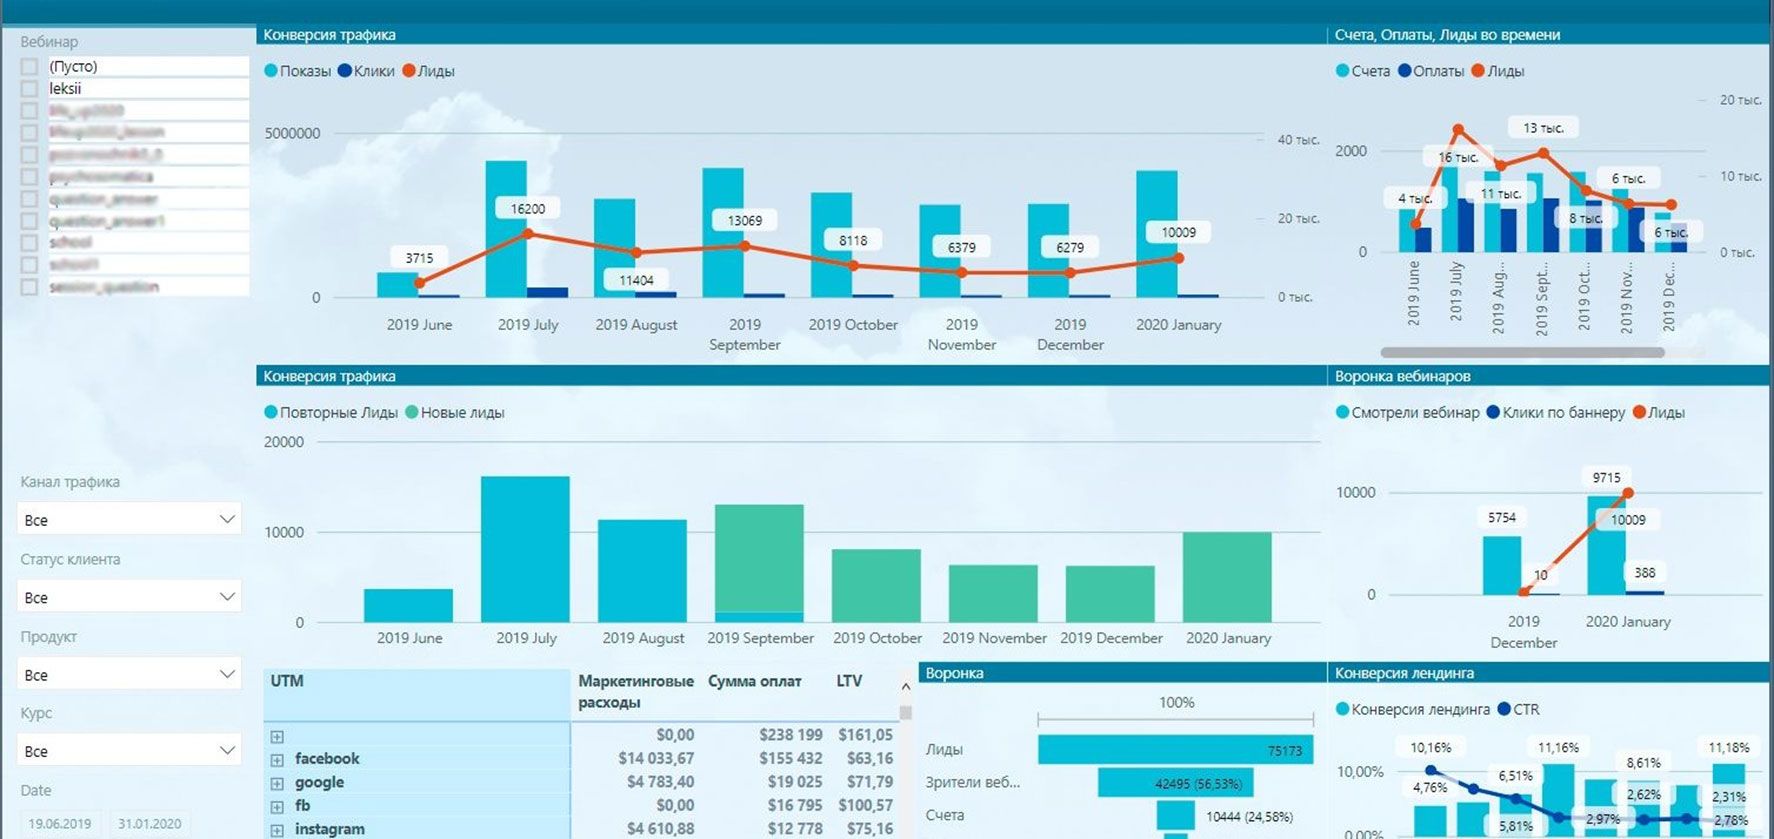
Each visualiser has its own unique set of features and settings to help you view and analyse your data.
Power BI also supports integration with a variety of external visualisations created by the community and developers. This allows you to expand the set of available visualisations and use more specialised graphs and visualisations depending on your data analysis needs.
Conclusions
Power BI is a powerful tool for analysing and visualising data in a business environment. It allows you to understand and present data in the form of graphs and charts, and to work with a variety of data sources.
Power Query is a built-in Power BI tool that provides data import capabilities. It allows you to connect to different data sources, cleanse and transform data, and prepare it for analysis and visualisation. Power Query is a full-featured extract, transform and load (ETL) tool that allows us to manage the data lifecycle, including collecting, processing and loading data into appropriate formats.
Power BI Features
- Provides a variety of options for importing and manipulating data, particularly using the M query language and DAX language.
- Supports connection to multiple data sources, including databases, Excel files, cloud services and more.
- Provides tools for data transformation, including filtering, sorting, grouping and merging tables.
- Allows you to model data by creating relationships between tables and using hierarchies.
- Provides the ability to automate the updating of data from multiple sources.
- Import data into Power BI from data source files, databases, cloud services and other sources.
- Power BI can use external tools and services, such as Python and R scripts, to scrape data from websites.
- Power BI provides a wide range of built-in visualisations, including charts, maps, graphs, tables, slices, maps, and standalone images.
- Users can customise the style, colours and layout of dashboards to create clear and attractive data visualisations.
- Power BI allows you to use interactive elements and filtering to interact with data and get answers to questions.
- Data in Power BI can be automatically updated from real-time sources.
- Power BI has advanced capabilities such as integration with artificial intelligence and machine learning, building complex data models, calculations, predictions, and automation through scripted extensions.
- DAX is a programming language that allows you to create formulas and expressions to calculate and analyse data in Power BI.
- DAX works with a data model, including tables, columns and relationships, and allows you to access data in the context of the model.
- No-code systems, such as Supermetrics, Zapier, Integromat and n8n, allow you to connect data sources to Power BI using visual programming with little or no code.
- Supermetrics is a low-code system with a wide range of pre-built connectors that make it easy to collect, process and integrate data from multiple sources.
- Zapier, Integromat and n8n are no-code systems that automate business processes and integrate data between different applications and services.
SHARE

OTHER ARTICLES BY THIS AUTHOR
Get the most exciting news first!
Expert articles, interviews with entrepreneurs and CEOs, research, analytics, and service reviews: be up to date with business and technology news and trends. Subscribe to the newsletter!
By clicking “Subscribe” you agree to Privacy Policy and consent using your contact data for newsletter purposes
OR FOLLOW ON:
