


What is cohort analysis: why and where to use it, how to conduct research

TABLE OF CONTENTS
Profit.Store

83
Cohort analysis is one of the methods used to study consumer behaviour. It shows how narrow groups of people (cohorts) behave when they have taken a particular action in a particular time period.
Cohort analysis allows marketers to identify patterns that may not be apparent when looking at general data, and to understand the behaviour of specific customer groups.
What is cohort analysis?
In marketing, a cohort is a group of customers who have taken the same action within a given time period. For example, they might have installed an app between 1 and 15 October. Cohort analysis tracks the customer journey of such groups.
Let's look at cohort analysis with an example. We want to find out how many users who installed the app in October will upgrade to the paid version and when they will do so. To do this, we will set up the cohort - define the group and the time, and track them for some time. This way we will know which channel brings in loyal users, when they make a purchase and at what point they uninstall the app.
An action and a timeframe are the only signs of a cohort. Within a group, there can be customers from completely different segments of the target audience. For example, men over 30 and women under 25.
Who can benefit from Cohort Analysis
Cohort analysis is relevant to any business, helping to increase conversion and optimise marketing activities. The tool is used in e-commerce, online gaming, mobile applications and SaaS.
In e-commerce, for example, cohort analysis is used to determine how well the extended sales funnel is working compared to the previous version. Or to analyse patterns in user behaviour to assess the response to advertising from a particular audience segment.
SaaS companies and mobile app developers use cohort analysis to identify key differences between new customers and those who signed up before updates. It is also used to identify popular plans, customer churn and the type of users who are more likely to upgrade to paid versions.
For games, cohorts are studied to identify differences between experienced players and newcomers. For example, analysts evaluate the reaction of old users to a loading delay. Or they calculate the stage at which a player starts to earn less.
Key metrics for cohort analysis
Cohort analysis is a method of analysis that allows you to evaluate the performance and behaviour of groups of users who have been divided into cohorts based on certain characteristics.
The key metrics of cohort analysis typically include
- Engagement frequency: Measures how often users interact with a product or service.
- Retention rate: The percentage of users who remain active after a period of time.
- Customer Acquisition Cost (CAC): The total cost of acquiring a new customer.
- Average revenue per user (ARPU): The average amount each user brings in as revenue.
- Lifetime value to customer acquisition cost ratio (LTV:CAC): Compares the total revenue generated by a customer over their lifecycle to the cost of acquiring them.
- Average time to first purchase: The time from user acquisition to first purchase.
- Repeat purchase rate: The percentage of users who have made more than one purchase.
These metrics help you understand how well a product or service is retaining users, attracting new customers and generating revenue.
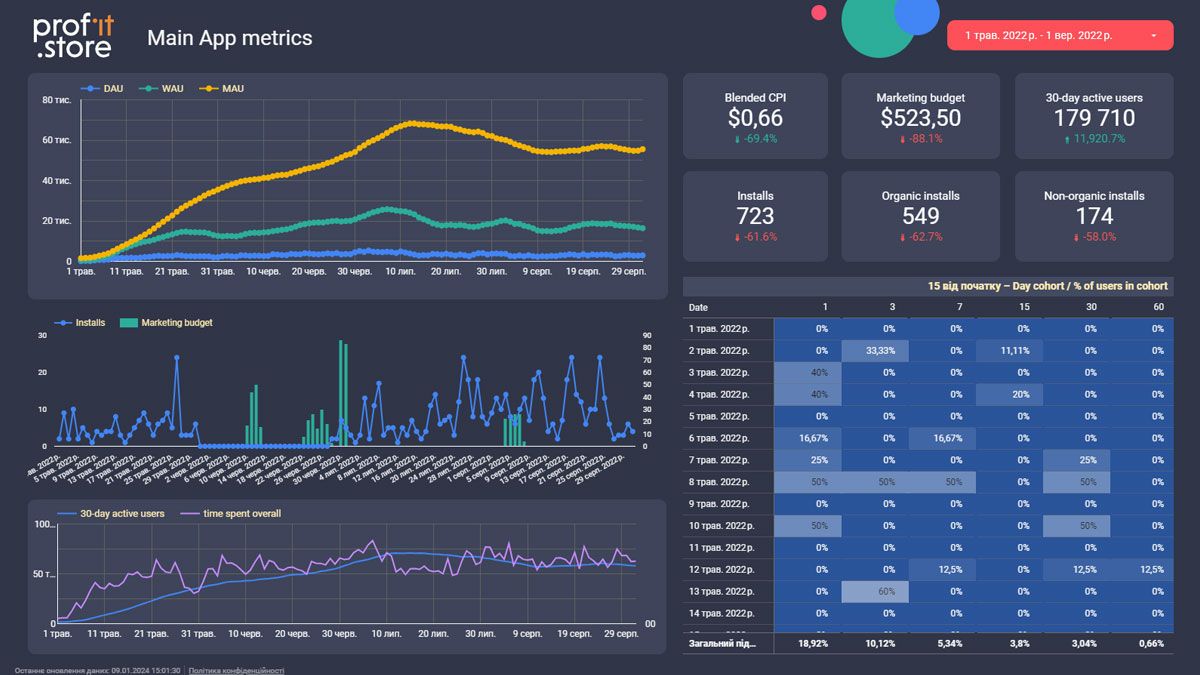
Let us consider an example of the implementation of cohort analysis using our case study of analytics for a mobile application.
The first dashboard contains, in addition to the cohort analysis, the main performance indicators of a mobile application, such as DAU, WAU, MAU, number of installations, advertising budget, etc.
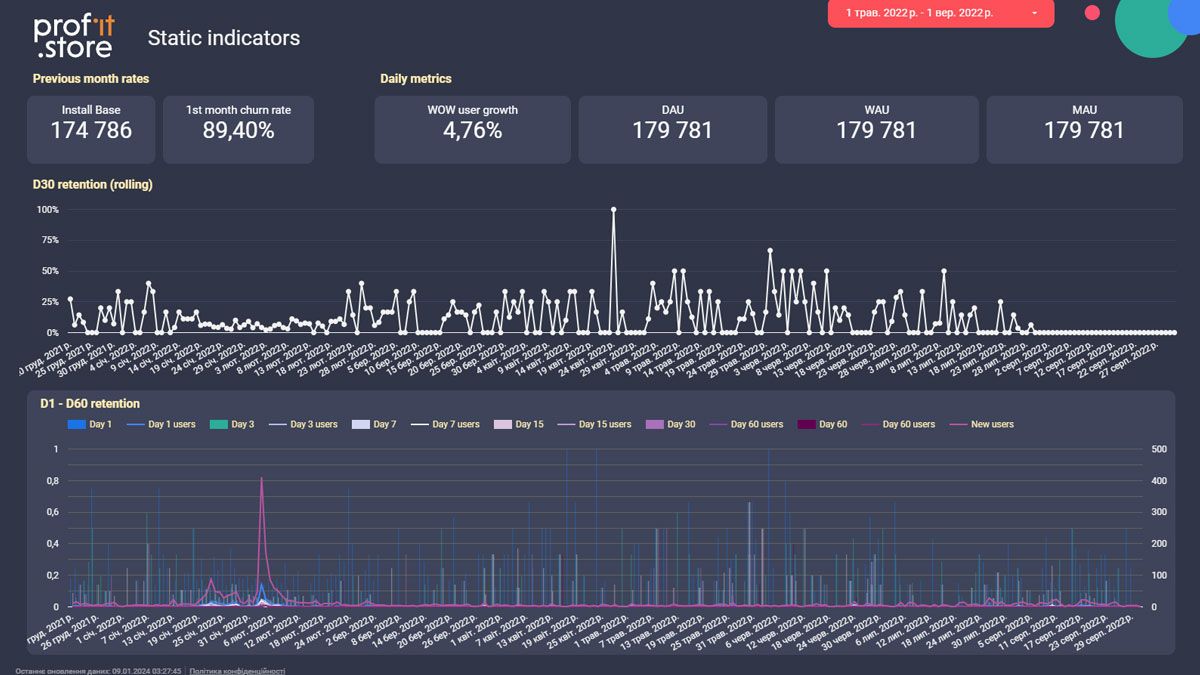
The second dashboard usually counts retention.
Here you can see the details of user retention:
What tasks does cohort analysis solve?
Evaluating advertising effectiveness
It takes one person an hour to make a purchase decision, and another six months. The latter may doubt the product or look for alternatives. As a result, they will take the targeted action much later.
Both customers come from the same contextual advertising. However, the time lag prevents marketers from objectively assessing effectiveness at the end of the month. The ROI - return on investment - will be low. This leads to the campaign being mistakenly stopped or adjusted.
Cohort analysis is used to determine the long-term payback of a contextual campaign. This involves assigning users who clicked on an ad in a losing month to a separate cohort. Then the ads are turned off for them and their behaviour is tracked for several months.
Marketers do this kind of research. It allows them to adjust their product or brand advertising strategy.
Refining the target customer profile
Gathering information on different cohorts helps you to refine the portrait of your target audience. Loyalty levels, seasonal activity, propensity to buy again - all this information shows who buys from you and how often.
Evaluate the effectiveness of different channels
Marketers use cohort analysis to identify effective channels and optimise ad spend.
Here's how they do it:
- Collect all new website visitors over the past month.
- Divide visitors into cohorts by source: mailing list, contextual advertising, social media.
Study the behaviour of each group: how many people returned to the site, made an order, left an enquiry, viewed pages.
As a result, marketers receive detailed reports on each source. Analyse channels with declining and average activity and change strategy. And abandon unprofitable ones.
Find and keep loyal customers
Ongoing channel analysis will reveal which source brings in more loyal customers. To do this, create a cohort of users over several months and divide them into groups by channel. Then, on a monthly basis, evaluate these groups based on retention rates and repeat purchases.
In this way, you can identify the most effective channel for attracting regular customers. They monitor the coefficients and respond in good time to any decline in customer interest.
Forecasting and increasing LTV
LTV (Lifetime Value) is the total profit a company receives over the entire period of its relationship with a customer. The metric helps to calculate the optimal cost of customer acquisition and reveals the peculiarities of customer behaviour in the dynamics. For example, the point at which a person stops buying.
Typically, the metric is calculated at the end of the relationship, but there is nothing stopping you from performing an interim LTV assessment by cohort. The data obtained is the average of the metric. The indicators for different segments are used to predict profits and prevent a decline in activity.
Refining A/B testing
These tests are used to test hypotheses. For example, a company has decided to update the functionality of its website. Half of the visitors are sent to the new version and the other half to the old one. The behaviour is observed and a conclusion is drawn: which option is preferred by the users.
The problem with this method is that there is no long-term prediction of conversion after updates. Cohort analysis helps to gather more complete data. This involves dividing visitors to the new and old versions into separate groups and running repeat reports a month after the test for comparison.
How to do research
First, indicators are defined, then cohorts are formed and compared. Let's take a closer look at each stage.
Stages of cohort analysis
Cohort analysis involves the following stages:
- Definition of the metric.
- Formation of cohorts.
- Comparing cohorts and analysing metrics.
To perform a cohort analysis, you need to determine:
- A cohort characteristic is an action for inclusion in the group. You can combine cohorts by any action you want to analyse the response to. For example, visiting a website, placing an order, receiving a consultation. The main thing is that users of the same cohort perform the same action.
- The size of the cohort is the time period of the action. You can create cohorts for different time periods. For example, one day, one week, one month or more.
- Reporting time - the duration of the cohort analysis. You can track the behaviour of cohort members for any length of time until you get the data you need.
- Key indicator - a metric for analysis. Cohort analysis allows you to analyse any metric that changes over time. For example, conversion, sales volume, average customer lifecycle, changes in the number of users over time, etc.
Once the cohorts are created, the next step is to compare them by metric. During the analysis, we identify differences and explain the pattern of behaviour specific to a particular cohort.
You can create multiple cohorts at the same time. Often, multiple groups of users are created for analysis with a difference in time for the same action. The behaviour of these groups is then compared.
For example, to track the payback of an advertising campaign, you can create a cohort, analyse its behaviour over several months and calculate the final figure.
And to calculate the length of a customer's journey from first visit to purchase, it is better to create several cohorts with the same promotion and different time periods. You can track the behaviour of different cohorts and calculate the average.
Defining key metrics
Metrics for cohort analysis fall into two groups:
- Reflects real user actions: purchase, full version upgrade, application installation, registration to purchase conversion and other product metrics.
- Reflect the external success of the company that does not bring financial benefits: likes, newsletter subscriptions, number of views and comments.
Consider research when choosing indicators. For example, the number of subscribers will help you assess the conversion rate of your newsletter, and time spent on the site will help you determine whether visitors are intentional about visiting the site and interested in the content.
Forming a cohort
Define the characteristics of the cohort:
- Sign. An action taken by group members, such as visiting a website or placing an order.
- Duration. The time period over which the action took place: from a few days to several months.
- Reporting period. How long you want to track the action.
You can create several cohorts with the same characteristics and different reporting periods.
Comparing cohorts and analysing metrics
You can manually perform a cohort analysis by following these steps:
- Collect data. The type of data depends on the event selected as the action.
- Download the data. The collected information is uploaded to Excel, Google Docs or another editor with a pivot table, or automated services based on BI systems are used.
- Analyse the data. Analyse how user behaviour changes over time.
To perform cohort analysis, you can use the functionality of Google Analytics. Cohort analysis in Google Analytics allows you to create cohorts by
- the date of the first visit;
- the first session;
- of the first transaction;
- of the first conversion.
Services for creating reports
Google Analytics 4
Open Google Analytics and go to the 'Search' section. On the left side of the screen, select Overview. Click on Template Gallery and Cohort Study. Set the conditions in the window on the left:
- segment - cohort action;
- parameters - additional characteristics about users, such as age and geolocation;
- indicators - the metrics you want to analyse.
The system will automatically generate a schedule.
Google spreadsheets or Excel
It is easier to create a pivot table. To do this:
- Upload data from web analytics and CRM services;
- Select all cells with data;
- click Create PivotTable in the Insert menu;
- Select which sheet to create it in;
- In the Rows and Columns settings, specify the action and period, and in Values, enter data from rows and columns with quantitative indicators.
Conclusion
Brief description of the cohort analysis
- Cohort analysis is the study of a group of customers who have taken the same action over a period of time.
- Different from segmentation - focus on a specific action and time frame.
- Cohorts are studied to refine target audience portraits, personalise sales, make long-term predictions and improve A/B test results.
- There is no universal metric for cohort analysis - the choice depends on the research objectives and product features.
- The source of data for analysis is web analytics and CRM systems.
- The main tools used to create reports are Google Analytics, Google Sheets and Excel.
What is cohort analysis used for in business?
Cohort analysis is most commonly used to solve the following tasks
- monitor the effectiveness of advertising campaigns
- tracking repeat visits
- conducting A/B testing
- identifying loyal customers
- Determine the payback period of channels;
- assess the effectiveness of launches
- analysing the effectiveness of different versions of mobile applications.
SHARE

OTHER ARTICLES BY THIS AUTHOR
Get the most exciting news first!
Expert articles, interviews with entrepreneurs and CEOs, research, analytics, and service reviews: be up to date with business and technology news and trends. Subscribe to the newsletter!
By clicking “Subscribe” you agree to Privacy Policy and consent using your contact data for newsletter purposes
OR FOLLOW ON:
