


Monitoring website speed and creating a Core Web Vitals report in Google Analytics 4 and Looker Studio
Core Web Vitals (CWV) and other website load speed metrics have become increasingly important in web design and digital marketing. It is therefore important to know how to use these tools to analyse and track changes.
In this context, we will provide information on how to create a detailed website load speed report using Google Analytics 4 and Looker Studio (formerly Data Studio), as well as how to effectively perform analysis based on CWV data.
Why monitor website speed metrics in Google Analytics 4?
The use of Core Web Vitals and other website load speed metrics is key to obtaining and analysing real user data, as opposed to lab data such as that provided by Google PageSpeed Insights. This is critical because lab data often does not reflect the actual user experience when a website loads.
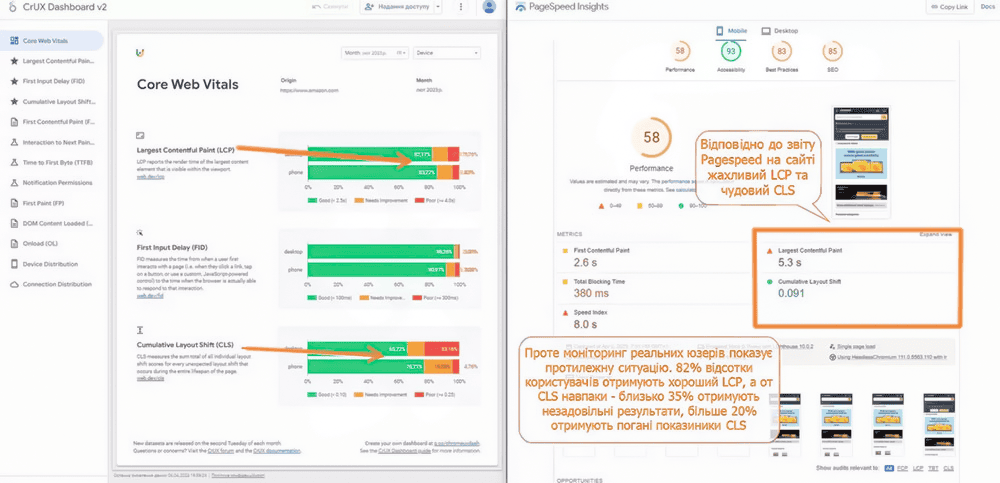
Lab data, such as that provided by Google PageSpeed Insights, typically represents an emulation of a single page loading on a single device. In contrast, real user monitoring, or field data, reflects a wide range of devices and provides more accurate indicators of how users interact with your site. This difference in methodology is fundamental.
Here's how you can use Core Web Vitals (CWV) for effective analysis:
- Collect data from users' browsers using Google Tag Manager (GTM).
- Classify the collected data into categories: 'good', 'bad', 'needs improvement'.
- Send this data to Google Analytics 4 for further analysis.
Report in Looker Studio
You can use data from GA4 to create more detailed analytical reports in Looker Studio. These reports enable visual evaluation:
- The percentage of events in the good/bad categories.
- Dynamics of changes per day and month.
- Analyse usage across devices and browsers.
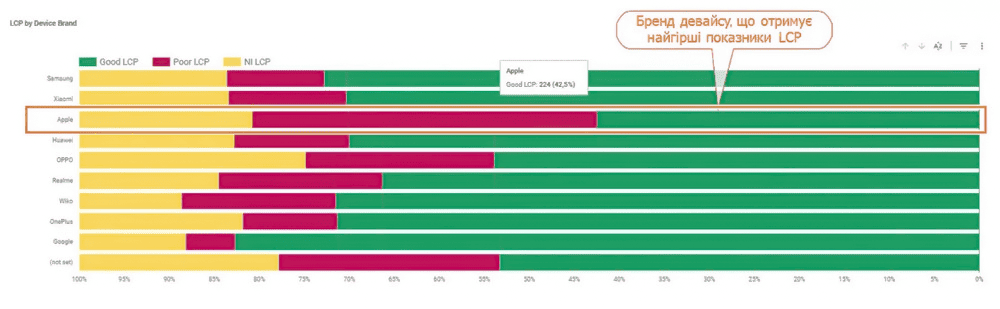
- Ability to filter data by country, site type, device brand and more.
Report in Google Analytics 4
GA4 includes the following data
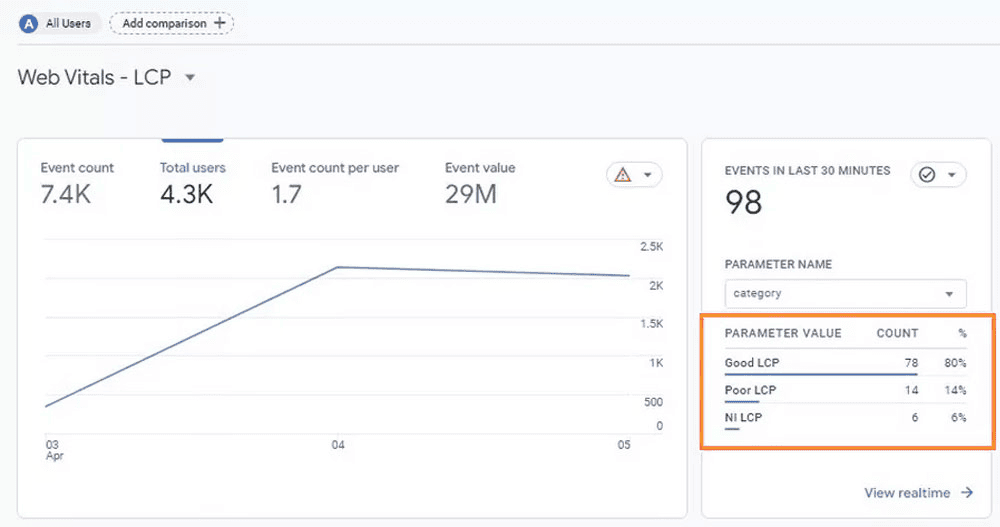
You can estimate the proportion of events in a particular category and compare it with data from other periods. For example, if the Good LCP indicator drops from 80% to 65%, this indicates that the strategy chosen was wrong.
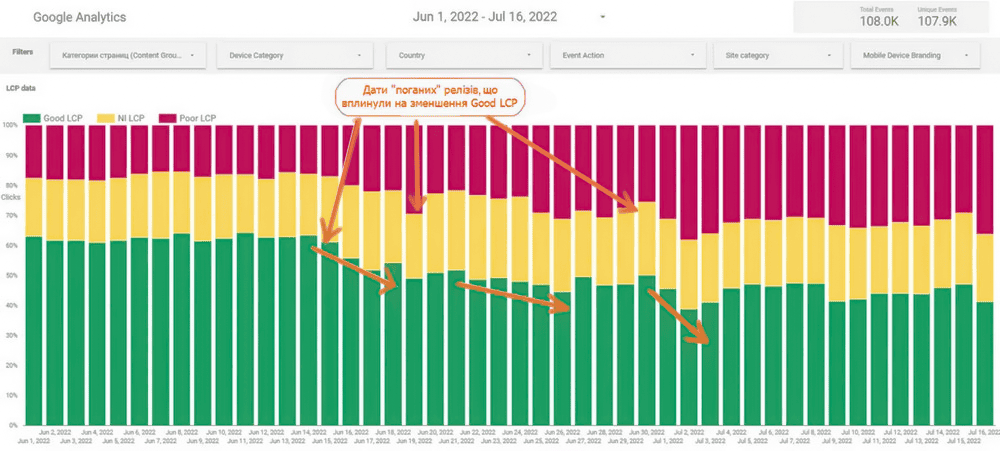
Looker Studio: analysis cases
- Daily analysis allowed us to pinpoint the exact date of the changes that caused the Good LCP score to drop. It was found that the drop was due to one of the inefficient development updates.
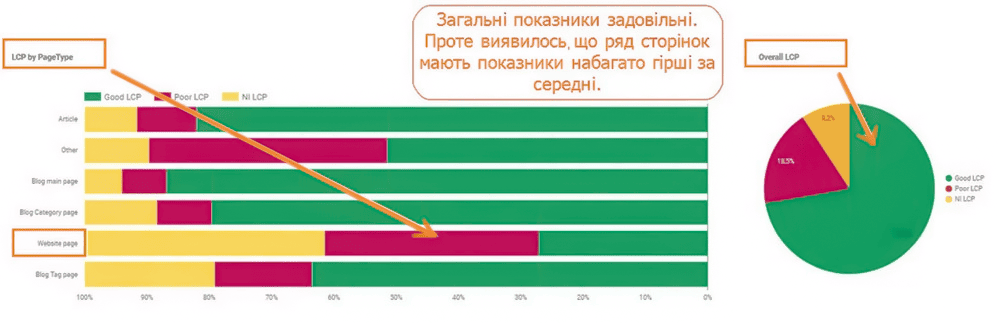
- A detailed analysis of content groups helped us to quickly identify the types of pages that had the most negative impact on overall performance.
- The analysis by device type revealed the reasons for the decline in conversions: a deterioration in the performance of devices that typically have high conversion rates.
To create a report using Core Web Vitals metrics
- Import the GTM container: import the CoreWebVitalsEvent.json file, following the instructions if necessary.
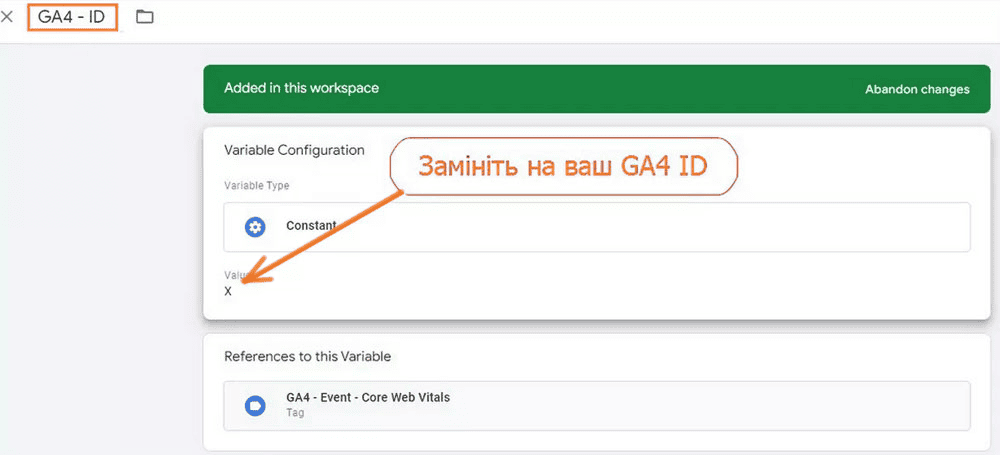
- Replace the GA4 ID in the GA4 - ID variable or in the GA4 - Event - Core Web Vitals tag.
- Publish the changes you have made.
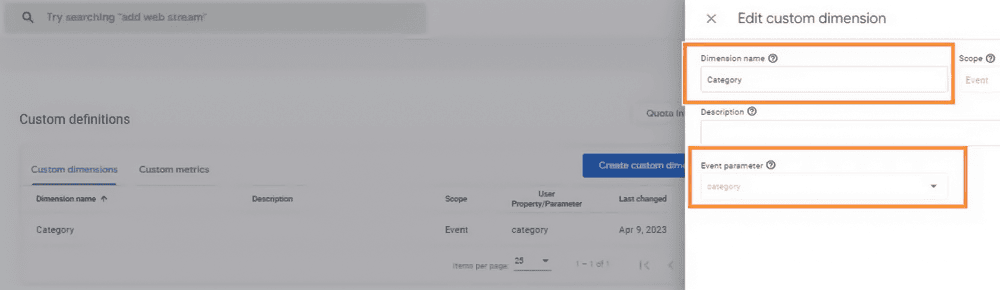
- In GA4, add a special parameter called Category and associate it with the Event parameter.
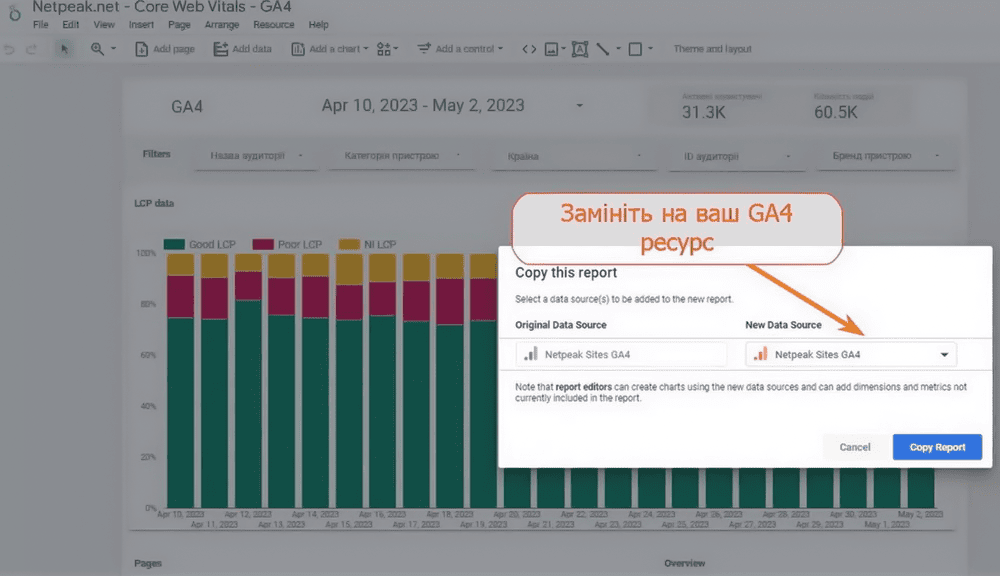
- Make a copy of the report in Looker Studio.
- Change the data source to your own GA4 account.
- Check the Breakdown Dimension setting, which should be set to Category.
- Wait a few days for the data to be collected.
Conclusion
Report is a must:
- For large websites that contain different types of pages. This is because different page types may have different loading and interaction requirements.
- For sites that are actively under development. These sites are subject to regular changes that may affect speed and compliance.
- For websites with a diverse audience from many countries and targeting multiple devices. Different user groups and devices may have different requirements and usage conditions.
Report is not compulsory:
- For small business websites. These sites often have a simple structure and fewer changes, so they are less prone to loading speed problems.
- For static websites that are rarely updated. In these cases, infrequent updates and content stability reduce the risk of loading speed issues, so a standard monthly CRUX report may be sufficient.