


How to find and calculate conversion rates in Google Analytics 4
Google Analytics allows you to track a variety of user actions as conversions, but the most valuable to a business are those that directly contribute to its success. For example, making a purchase, viewing product details or filling out a contact form. The percentage of website visitors who complete these actions, known as the conversion rate, is a key performance indicator and, of course, available in Google Analytics 4.
Conversion rate in Google Analytics 4
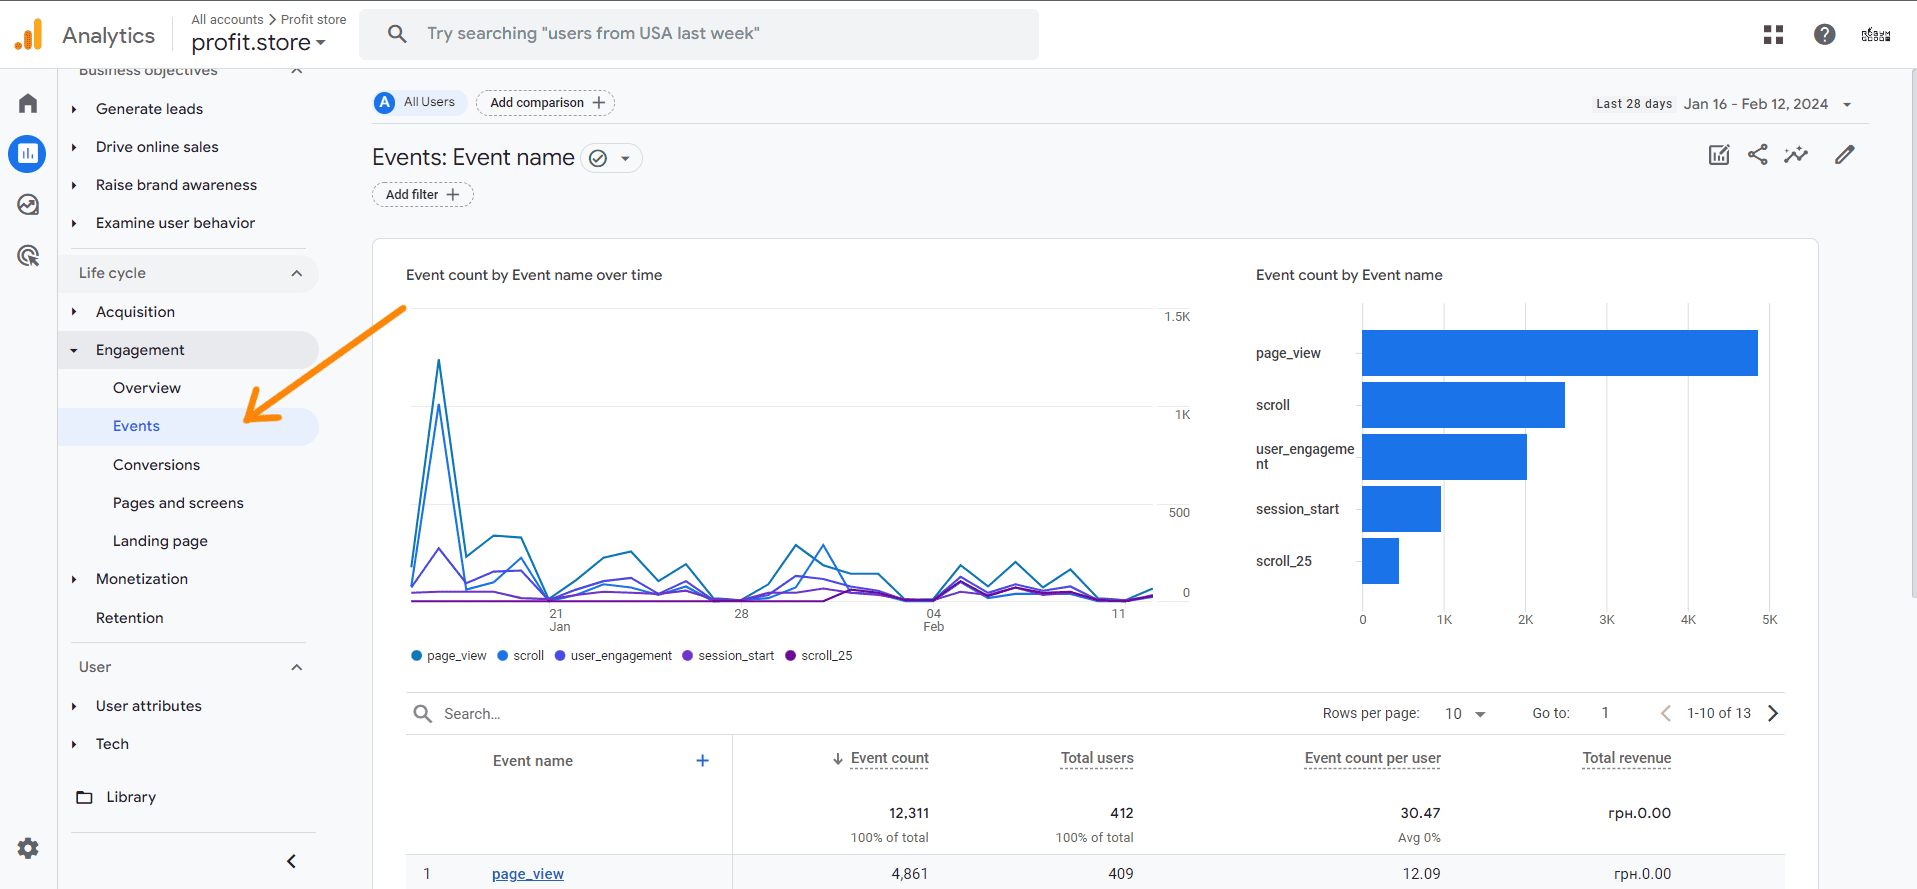
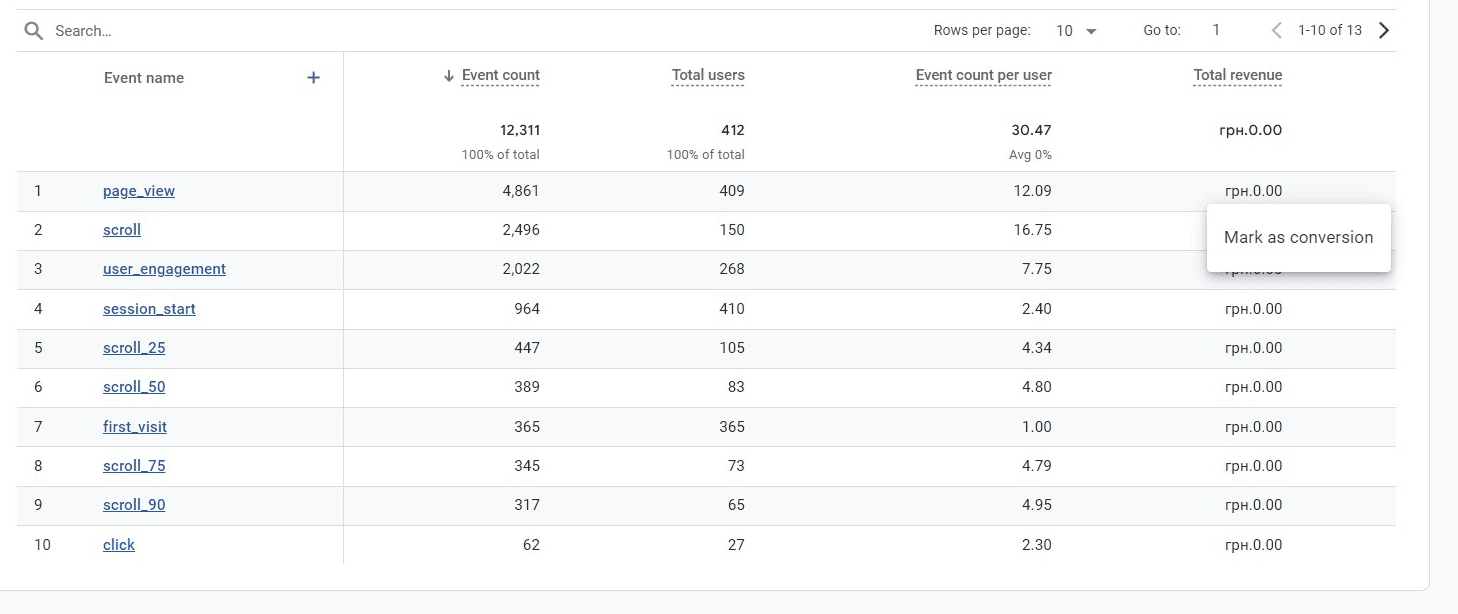
Google Analytics 4 introduces the event-driven data model. This means that user actions are tracked as separate events, and traditional goals are now replaced by conversions, which are also based on events. To set up conversions in Google Analytics 4, you'll need to go to the Events report and define which events are considered conversions. It's important to note that you can set up to 30 event-based conversions for each tracked resource in GA4, whether it's a website or an app.
It's important to note that in Google Analytics 4, the 'purchase' event for websites is automatically treated as a conversion. However, to accurately track purchases, you need to set up specific e-commerce events. This allows you to provide detailed analysis of purchases, including information about products and transaction amounts.
How to find and calculate your conversion rate in Google Analytics 4
There are two main types of conversions:
- Conversion rate per session, which shows the percentage of sessions that contain at least one conversion. This metric is the same as the one used in Universal Analytics.
- User Conversion Rate, which measures the percentage of unique users who made at least one conversion compared to the total number of users on the site.
Adding conversion rates to a standard report
To include conversion rates in standard Google Analytics 4 reports, follow these steps
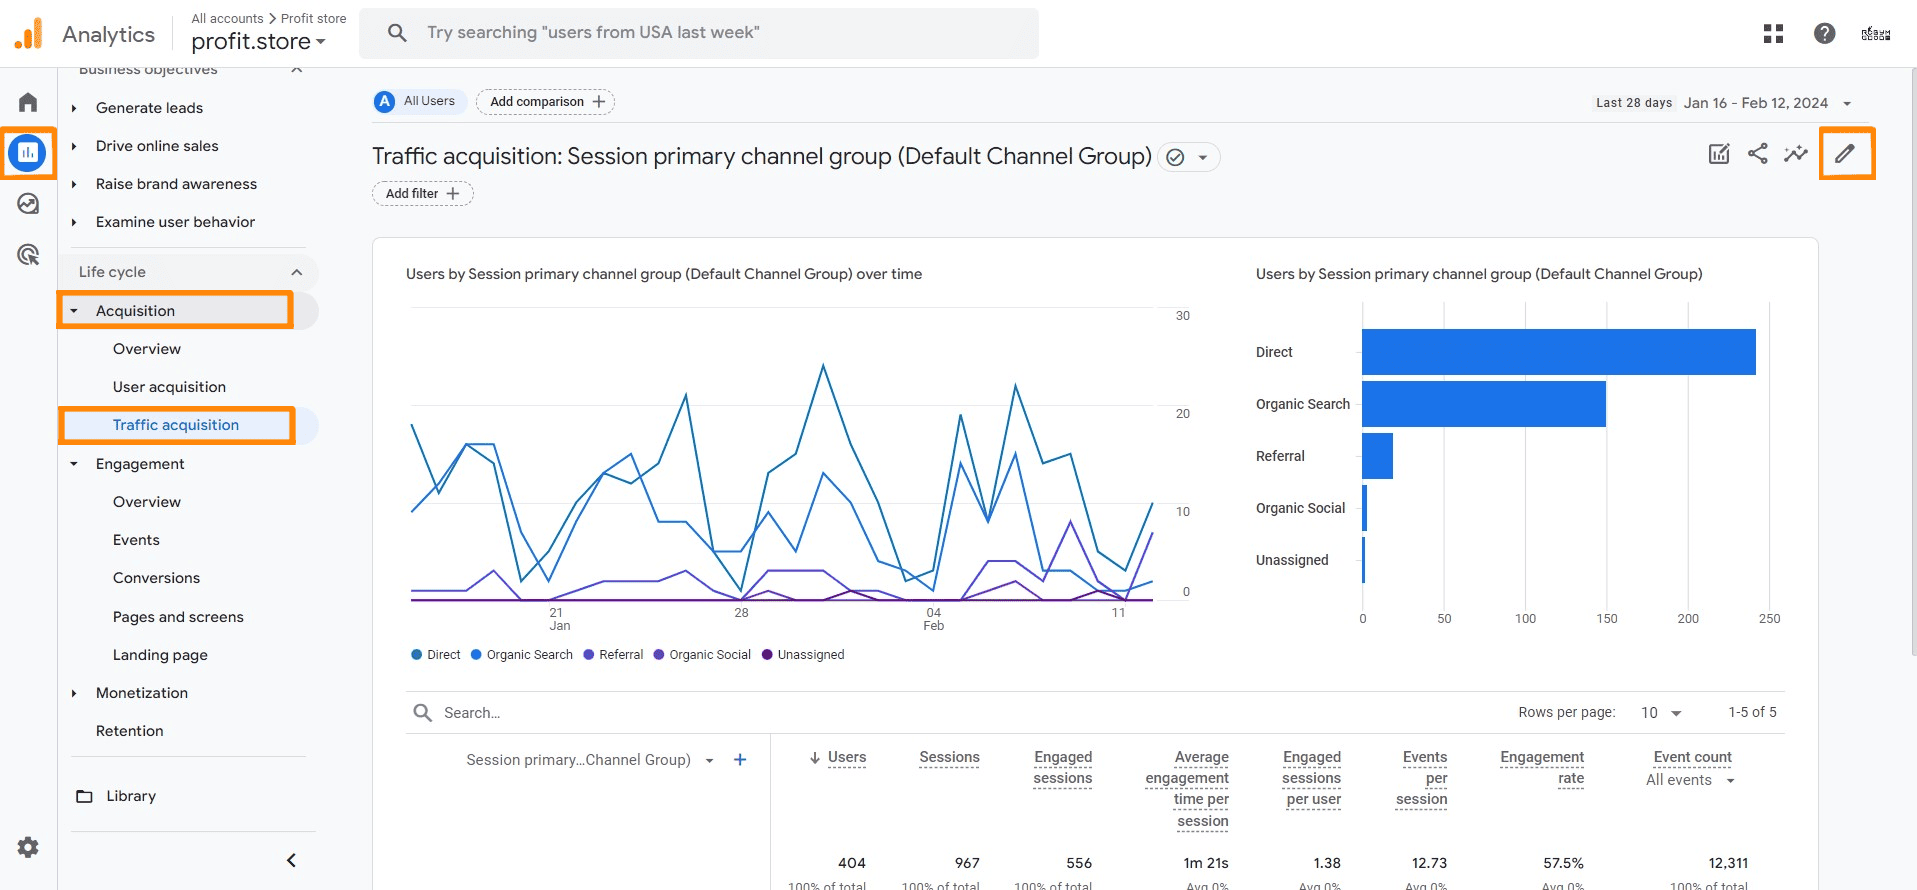
- Open the Reports section, navigate to Traffic Sources and select Traffic Acquisition. Locate and click the edit pencil icon in the top right corner.
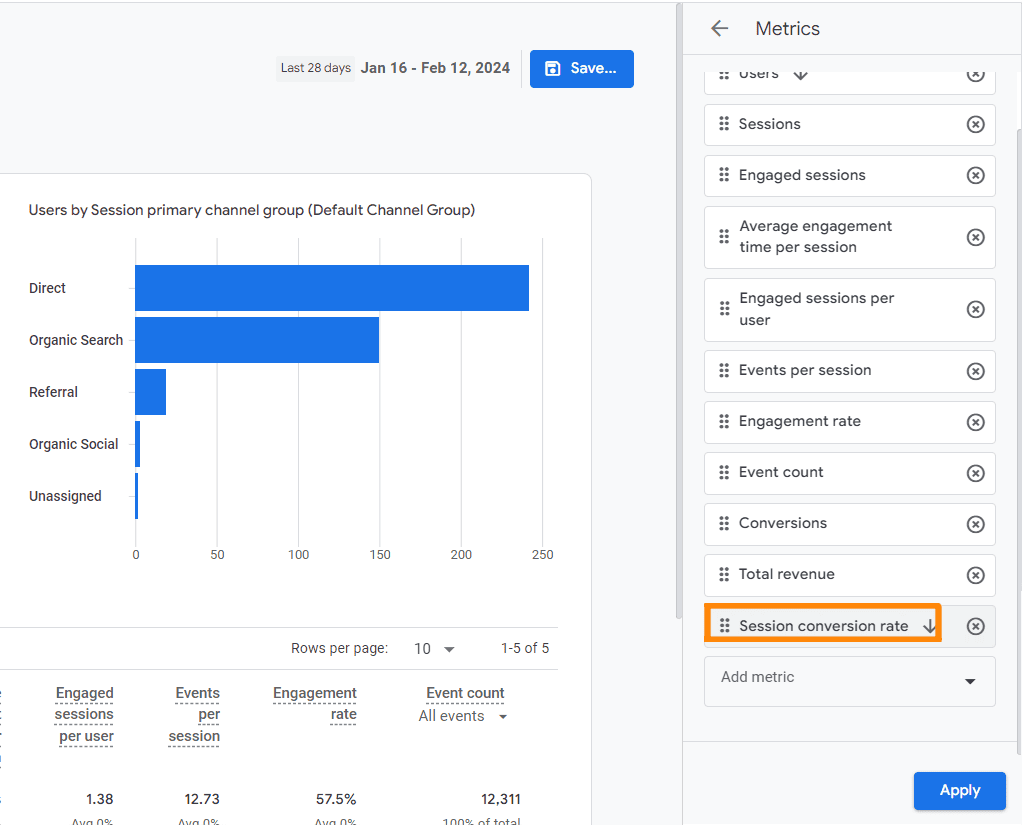
- Click on the Metrics section. Here you can find and select 'User Conversion Rate' or 'Conversion Rate per Session', depending on which metric you want to add.
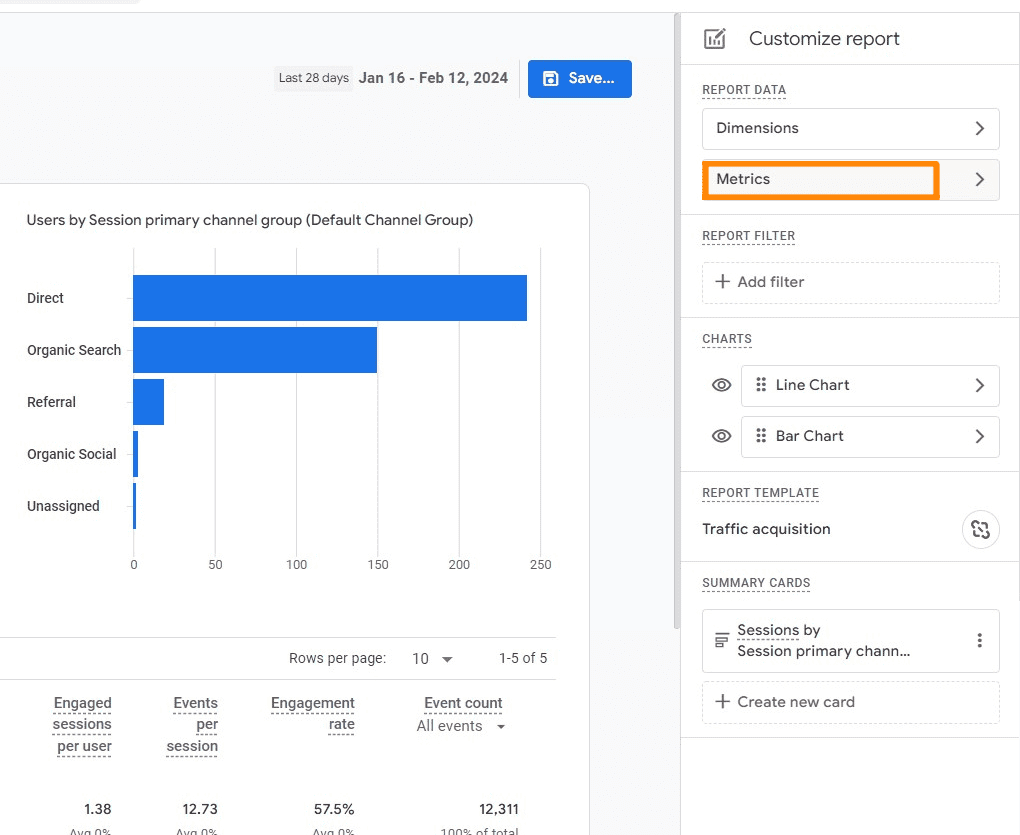
After selecting the appropriate indicator, click the Apply button to include the new indicator in your report.
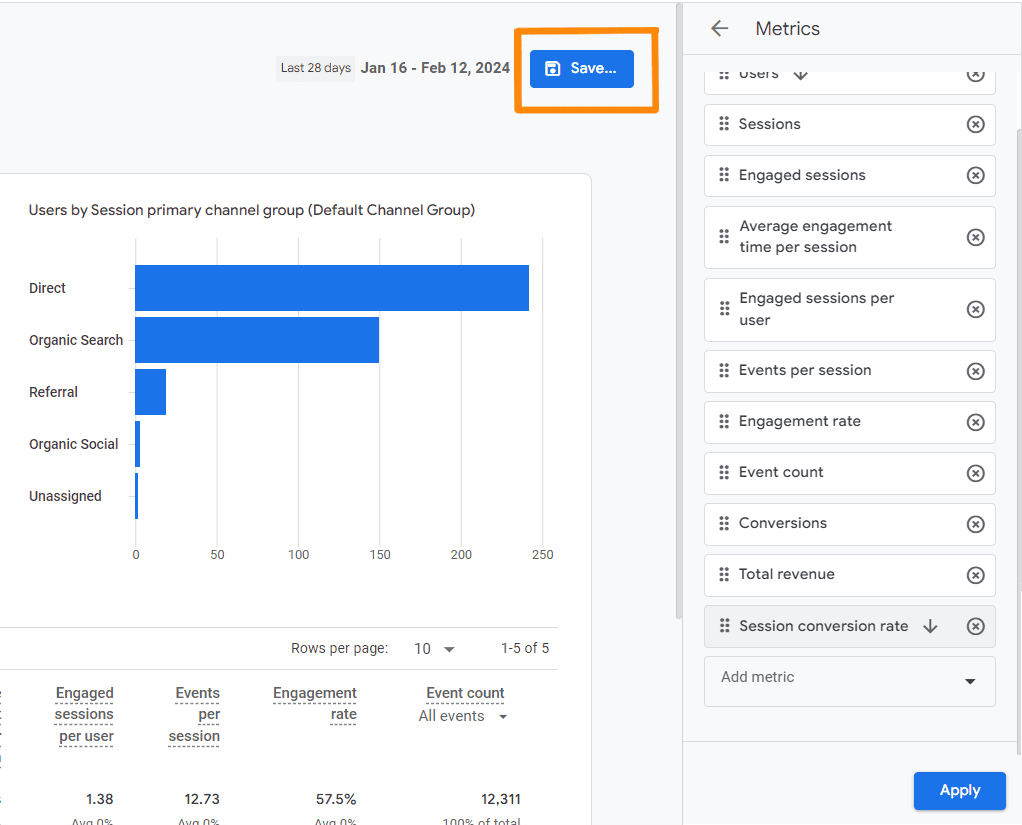
- Save any changes you have made by clicking on the appropriate Save button.
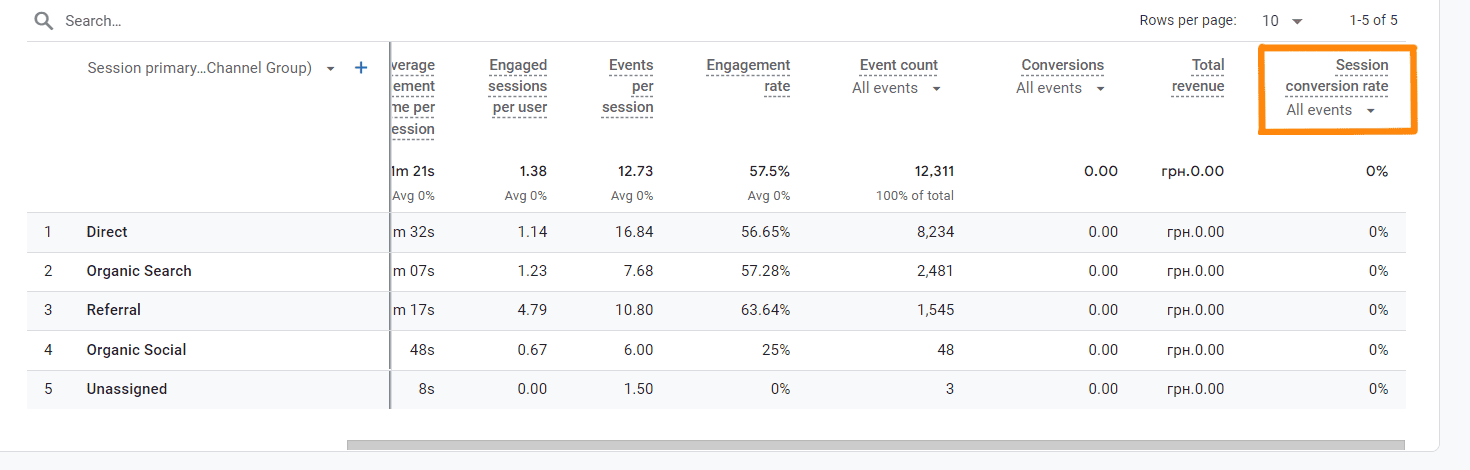
Conversion rate per session in standard report:
Creating a study using a conversion rate
To set up a study in Google Analytics using a user or session conversion rate, follow these steps
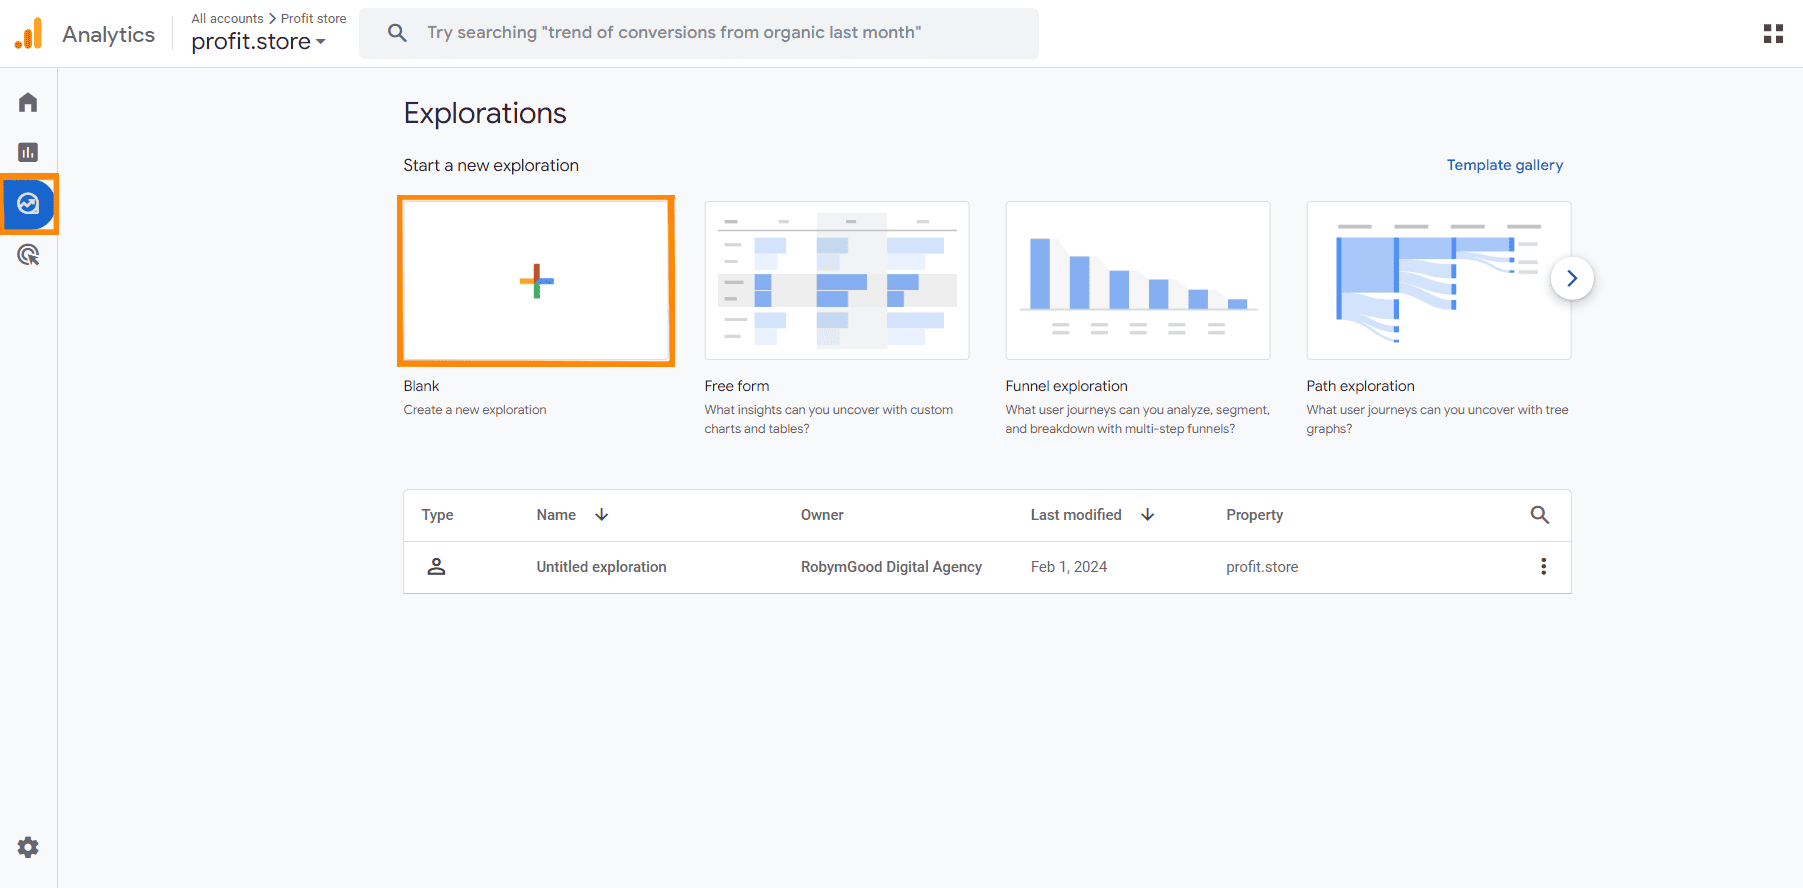
- In the left sidebar of Google Analytics, find the 'Studies' section and click the button to create a new study..
- Open the Settings tab.
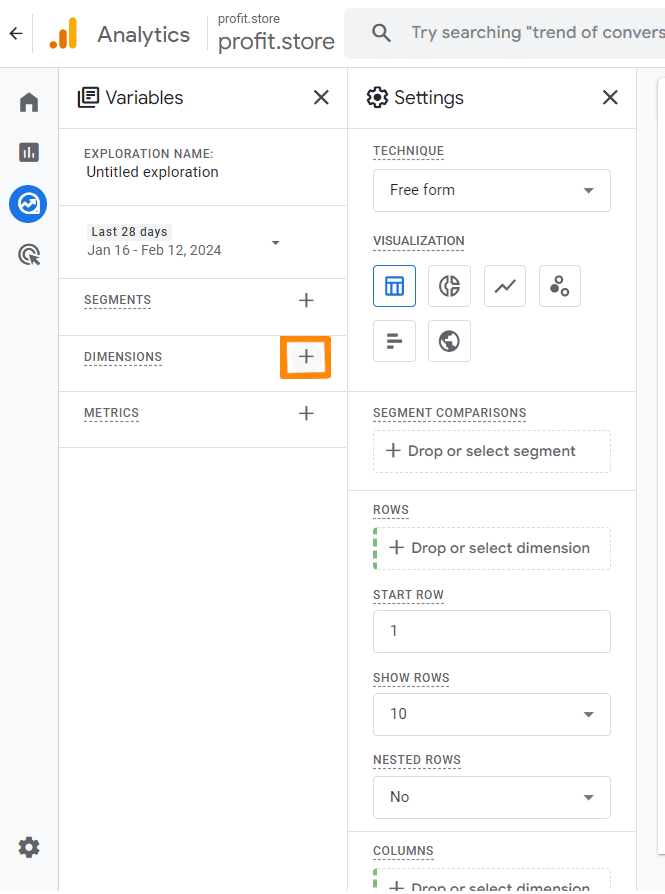
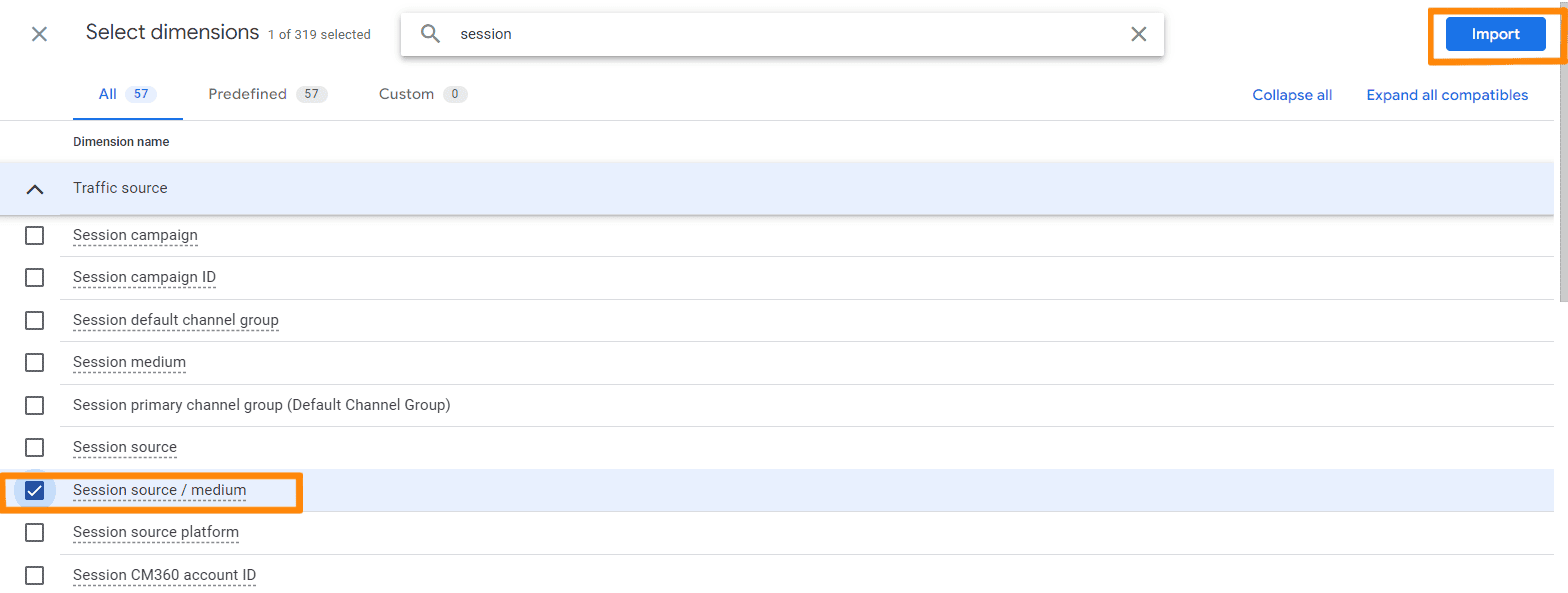
- Select the Session Source or Medium option and click Import.
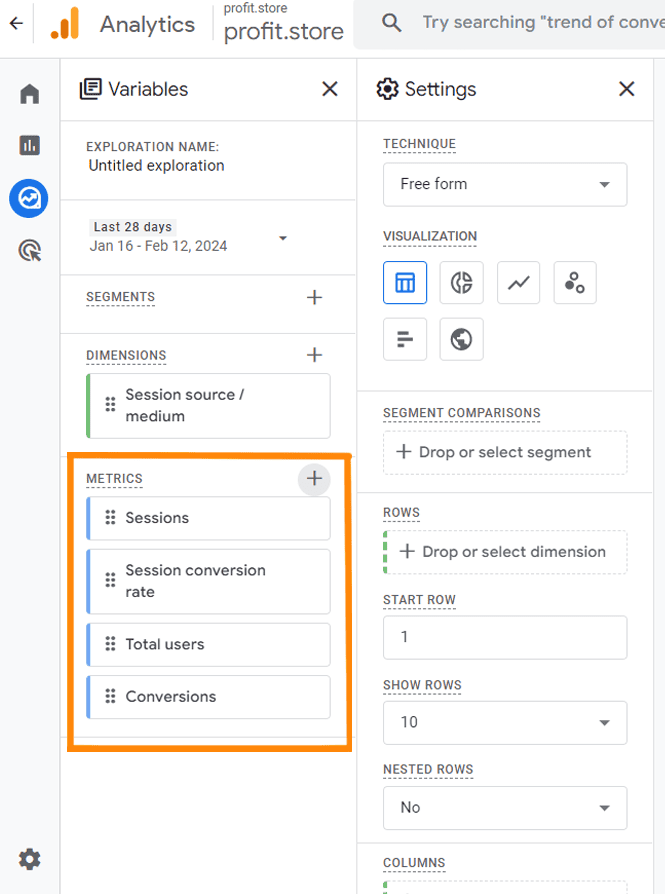
- In the Variables section, add the metrics you want to include in the report. These can be metrics such as sessions, total users, conversions, user conversion rate or conversion rate per session. Once you have selected the metrics, click Import.
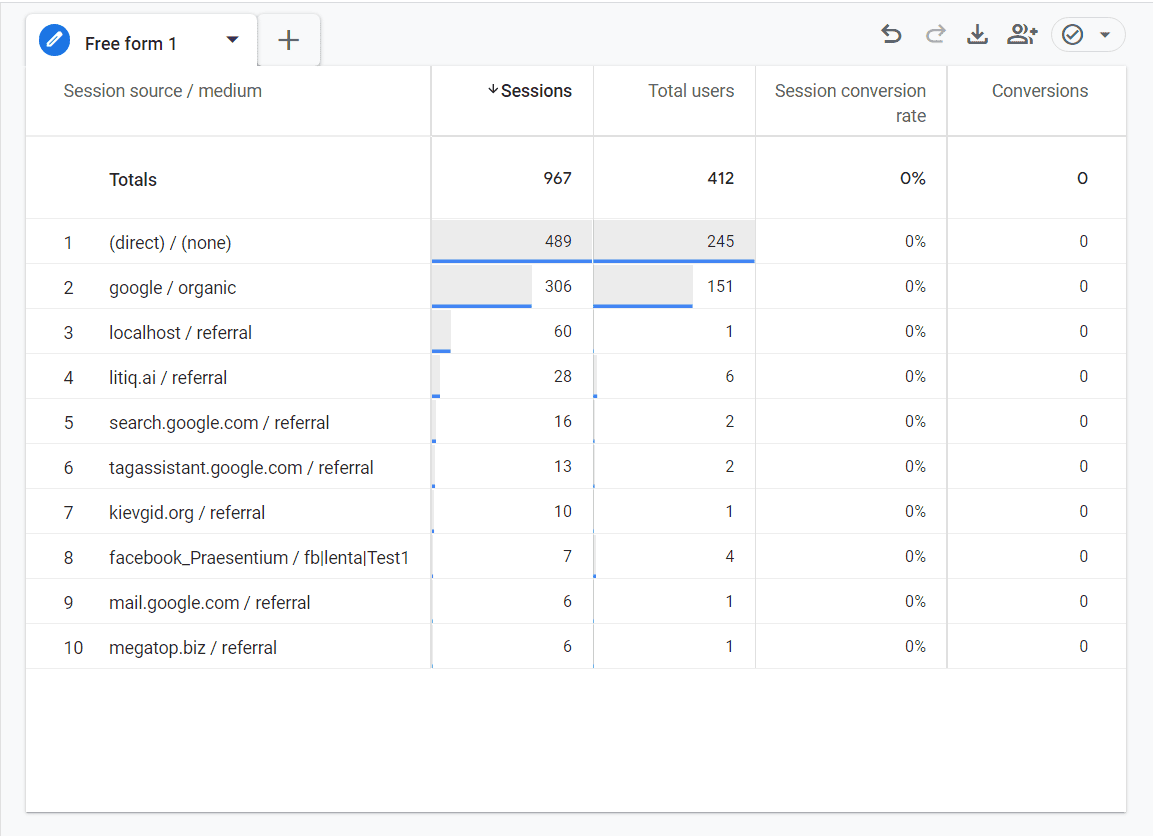
- Drag the selected source or channel of the session into the Rows section and the selected metrics into the Values section. This will give you a list of the most effective sources or channels with their respective conversion rates.
Conclusion
The conversion rate in Google Analytics 4 is measured as a percentage and is presented in two main formats that serve different purposes:
- Session Conversion Rate is the percentage of sessions that contain at least one conversion compared to the total number of sessions for a given time period. This metric is important for evaluating the effectiveness of short-term marketing activities or specific promotions.
- User Conversion Rate - shows the percentage of unique users who converted compared to the total number of users. This metric is useful for understanding the overall effectiveness of marketing efforts over a longer period of time.
Both metrics are important for evaluating the effectiveness of different marketing channels and campaigns. These metrics can be used to determine whether a marketing channel is gaining or losing effectiveness. They can be integrated into standard Google Analytics reports4 or used to create custom studies that allow for deeper data analysis.