


Amazon QuickSight: how to control your data with the AWS BI tool

TABLE OF CONTENTS
Profit.Store

235
Amazon QuickSight is an AWS business intelligence tool that provides analytical information to decision makers in a company.
Data analysis and analytical decision-making have become essential elements of successful business development.
In such cases, tools like Amazon QuickSight become quite important. Amazon QuickSight allows you to quickly analyse data from various sources and present it with stunning visuals and interactive dashboards. This greatly simplifies the process of making strategic decisions based on data analysis, helping businesses to be more efficient and competitive.
What is Amazon QuickSight?
Amazon QuickSight is a fast, cloud-based, managed business intelligence service that lets you create data visualisations and dashboards powered by machine learning. Amazon QuickSight competes with other business intelligence tools such as Salesforce's Tableau and Microsoft's Power BI.
AWS QuickSight makes it easy to combine data from different sources and provides powerful user management tools. QuickSight allows users without programming skills to explore data and visualise dashboards. These interactive dashboards can be easily integrated into many applications, portals, and websites. The QuickSight platform integrates with a wide range of services, including Amazon Redshift, Amazon Athena and all AWS services, Jira, ServiceNow, Adobe Analytics, GitHub, Salesforce, local Excel files (CSV, XLSX, JSON), and more.
Amazon QuickSight was first introduced at re:Invent 2015. It offers a faster and more intuitive way to work with business intelligence than other tools. One of its key benefits is economic, as QuickSight offers a more affordable pricing policy for users compared to other paid business intelligence tools.
What is Amazon QuickSight used for?
Amazon QuickSight is a business intelligence tool that is part of the Amazon Web Services (AWS) platform.
Amazon powers the QuickSight platform with its fast parallel computing system, SPICE. "SPICE is specifically designed for fast and responsive data visualisation.SPICE keeps your data in the system until you decide to delete it. By importing data into SPICE, you can increase the productivity of your data sets by avoiding direct database queries.
Amazon QuickSight provides organisations with deep access to information in an interactive visual environment. The platform includes a natural language query tool called QuickSight Q, which allows users to ask questions about their data in plain English. BI teams don't need to build data models for specific data sets. As the number of users using Q grows, it becomes more powerful with a built-in dictionary.
How do I visualise data with Amazon QuickSight?
Amazon QuickSight interactive dashboards:
1. Collect and load data
Amazon QuickSight can import and analyse data from a variety of sources, including Aurora, Athena, Redshift, Simple Storage Service (S3), and Elasticsearch Service 7.7.It can also integrate with your on-premises databases, file uploads, and data sources through APIs such as Salesforce. Amazon QuickSight also supports the processing of different types of information, such as click-through, order, and financial data.
2. Connect to data
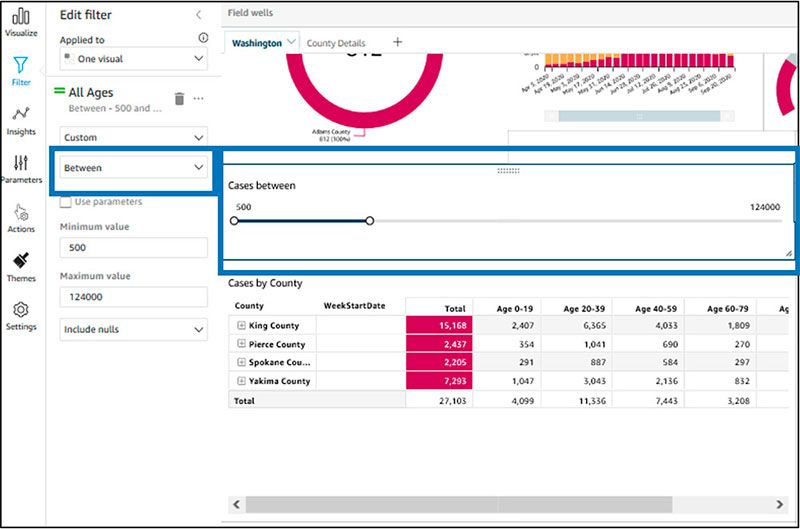
Amazon QuickSight can easily connect to a wide variety of data sources, regardless of their location, whether it's an AWS cloud platform, SaaS services, third-party applications, or even files in CSV, XLSX, JSON, and other formats. Before analysis begins, Amazon QuickSight prepares the data, including filtering, renaming fields, changing data types (if necessary), adding calculated fields, and building SQL queries.
3. Data Analysis
Amazon QuickSight analyses data and uses the fast SPICE (Super-fast, Parallel, In-memory, Calculation Engine) to perform calculations and create graphs efficiently. The main advantage of SPICE is the amount of memory, which eliminates the need to retrieve data every time the analysis changes.
4. Create visualisations
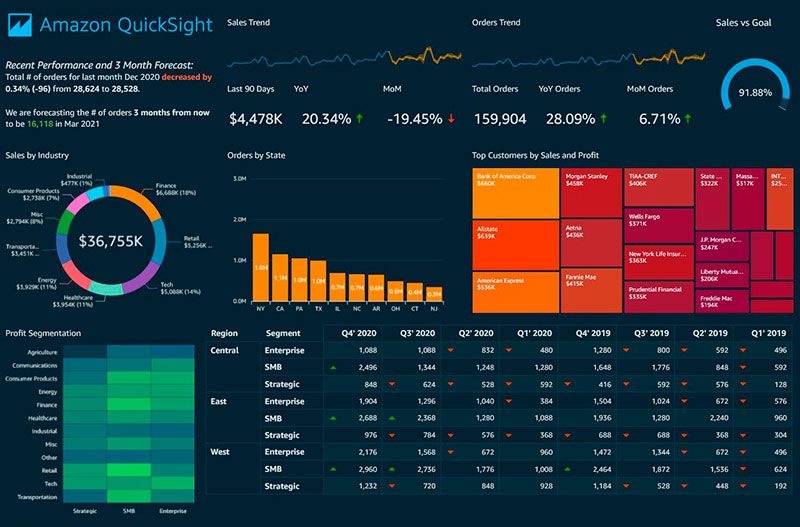
QuickSight creates visualisations that users can organise and customise. What's more, users no longer need to perform manual extract, transform and load operations. The tool provides access to interactive dashboards, email reports and built-in analytics that business users can access. The QuickSight workspace also provides interactive graphs, charts, tables, stories, sheets and many other types of visuals. With built-in analytics, users can view and create dashboards within their business applications.
Amazon QuickSight allows you to create visualisations to organise and customise your data. The platform provides access to interactive dashboards, the ability to email reports, and built-in analytics. The QuickSight workspace also provides interactive graphs, charts, tables, stories, sheets, and many other types of visuals.
Amazon QuickSight visualisations
QuickSight isn't just about BI, it's also about beautiful visuals. Although more expensive BI solutions such as Tableau have a larger set of visualisations, we subjectively found the basic visualisations offered by QuickSight to be more practical.
The visualisation suite on the QuickSight platform includes the following components
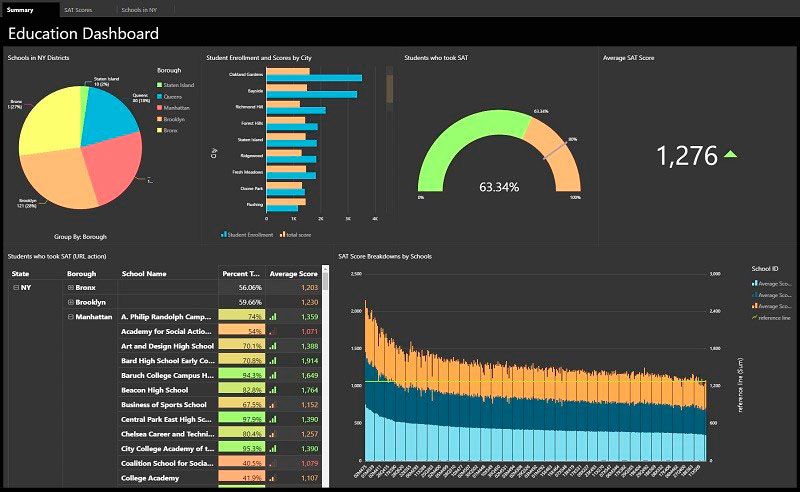
Visuals
A visual is a graphical representation of data in the form of a table, chart or graph. And AutoGraph mode uses an automatic algorithm to choose the best way to visualise your data. You can also choose your own visualisations from a variety of options, including heat maps, charts, combination graphs, pivot tables and more.
Insights
Insights is a feature that provides data interpretation as part of your analysis. In QuickSight Enterprise Edition, it automatically suggests relevant insights using machine learning. This feature helps automate the analysis process and provides useful recommendations to improve your solution based on the data.
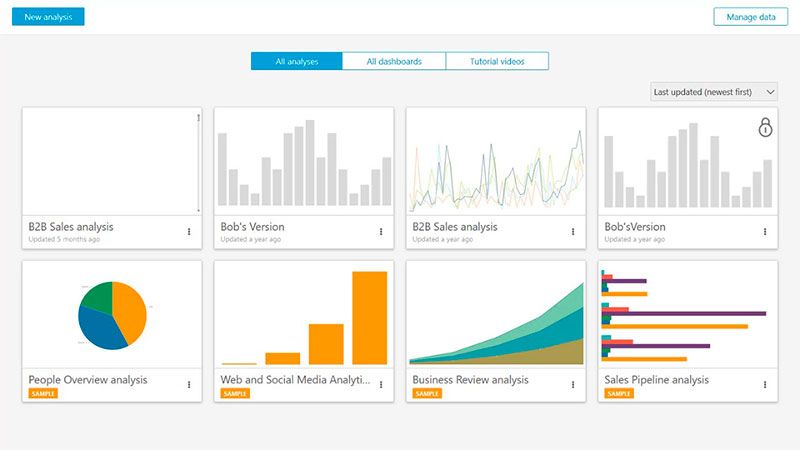
Sheets
Sheets in Amazon QuickSight are groups of visualisations that appear on a single page. Your analysis can consist of more than one sheet, each containing related visualisations that can work individually or together. This gives users the ability to create structured and easy-to-understand reports and analyses to further explore their data.
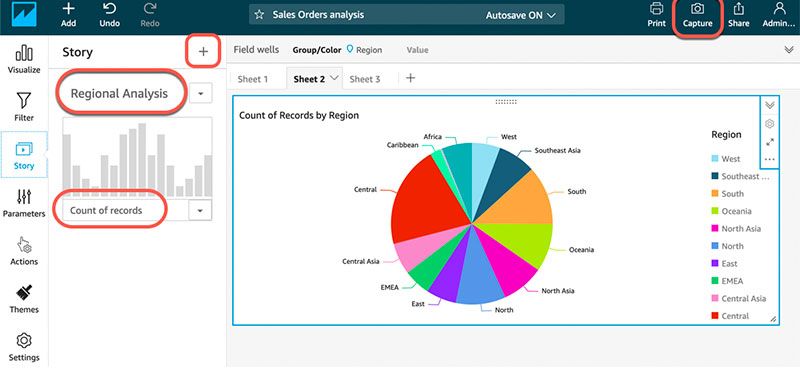
Stories
The Stories feature in Amazon QuickSight allows you to create sets of visuals that can be presented in a slideshow-like fashion. Users can scroll through Story Scenes to explore different aspects of their analysis. Story scenes are not static - they update in real time, just like all the other graphs, charts, and data in the dashboard.
Amazon QuickSight Pricing
Pricing for the Standard Edition of AWS QuickSight
The standard version of QuickSight includes one free user with 1 GB of AWS SPICE storage. After that, the cost of users is $9 per user per month for an annual subscription.
If you pay monthly, the price is $12 per user per month. AWS gives each customer 10 GB of SPICE storage for free. However, the cost of additional capacity is 25 cents per gigabyte for any additional capacity.
AWS QuickSight Enterprise Edition pricing
Pricing for the enterprise version of QuickSight is more complex and is divided into two categories of users: readers and authors.
A QuickSight reader is a user who uses interactive dashboards. Readers can view shared dashboards in a system, filter data, drill down, or export data to a CSV file using a browser or mobile application.
QuickSight authors can import data, design and publish interactive dashboards, customise reports and manage users.
2 QuickSight account options in reader mode:
- If your user base is predictable. The cost is 30 cents per session, provided a session lasts 30 minutes and starts when the reader logs in. It's important to note that you only pay for the time the user is actively interacting with the dashboard. The maximum amount per user is $5 per month, provided the reader is active enough to reach or exceed 17 sessions per month.
- For authors, the cost of an account is based on the number of users. The price is set individually for each author and may vary. The initial cost is $18 per user per month, provided you pay for an annual subscription. After that, the price may increase to $24 per user per month. If you choose the monthly plan, each user gets 10GB of SPICE for free, and additional SPICE costs 38 cents per gigabyte. SPICE is where data is stored for quick analysis and visualisation, and the amount of SPICE is important to the performance and speed of QuickSight.
Amazon QuickSight offers users a free 60-day trial. This allows you to set up readers and user authors for your team and organisation.
Pros and Cons of Amazon QuickSight
| Pros. |
|---|

|
|
|
|
|
| Cons. |
|---|

|
|
|
SHARE

OTHER ARTICLES BY THIS AUTHOR
Get the most exciting news first!
Expert articles, interviews with entrepreneurs and CEOs, research, analytics, and service reviews: be up to date with business and technology news and trends. Subscribe to the newsletter!
By clicking “Subscribe” you agree to Privacy Policy and consent using your contact data for newsletter purposes
OR FOLLOW ON:
