E-Commerce client’s case

TABLE OF CONTENTS
Profit.Store

108
How it all started
How often have you encountered the fact that the price of a lead is constantly increasing and the qualifications of marketers raise questions?
Such questions appeared to our client, but, unfortunately, not at the stage when everything was going according to plan, but when the cash gap came, because they believed that everything would be fine.
First, the client turned to an advertising agency that is our partner. The agency conducted a detailed audit of the current situation and found out how the client got to this point, and it took a long time, by the way. As it turned out, marketing did not work with the customer base, they attracted only cold traffic all the time, thus depriving themselves of huge opportunities in advertising and sales.
In the course of long negotiations, a decision was made together with an advertising agency to develop an automated service specifically for working with the client base, which at that time was already quite large.
We agreed to implement the following
- RFM segmentation, we chose to segment the client base
- Develop dashboards to monitor the effectiveness of communication and sales in each segment
- Create a suitable remarketing list for each segment in the Google Ads office, a retargeting list in Facebook Ads, lists for email mailings
- Set up an automated process of transferring client contacts between lists in advertising services when moving from one segment to another
- Develop an analytical system for detailing the effectiveness of advertising offers in each channel for each RFM segment
Schematic representation of the project
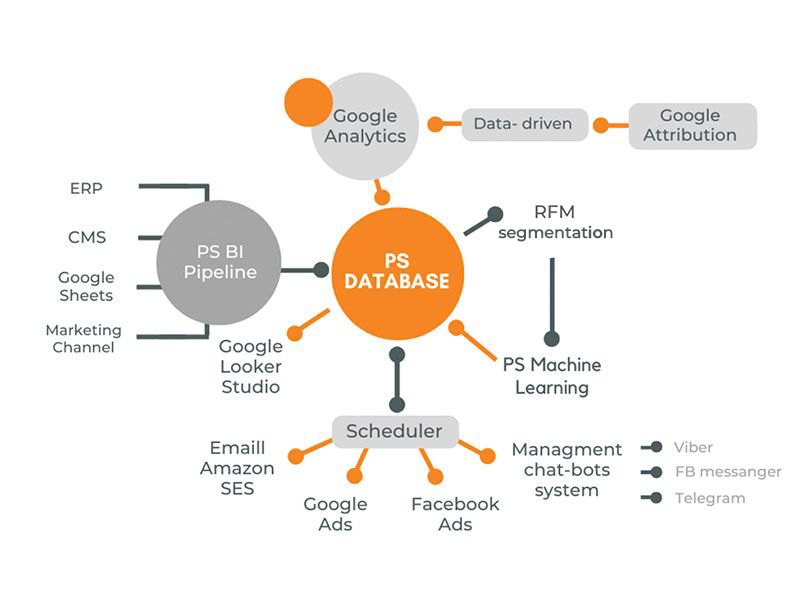
More details on each point:
RFM segmentation
- The basis of RFM segmentation is the distribution of the base according to the established limits of 3 parameters, namely: R (Recency: purchase age), F (Frequency: purchase frequency) and M (Monetary: purchase amount). After a detailed study of the indicators, the following segments were identified:
- VIP
- permanent
- average check
- one-time
- risk zone
- outflow
Of course, we did not limit ourselves to the usual segmentation and made categories, groups and the products, taking into account the customer parameters for each segment of the RFM segmentation. As a bonus, they did not forget to make the penetration of the middle check.
Dashboard of general segmentation
- Since our strongest point is the creation of analytical systems, of course, using our experience, we went to develop dashboards to monitor the effectiveness of all this action. So, everything worked out, this is such a beauty:
General segmentation board:
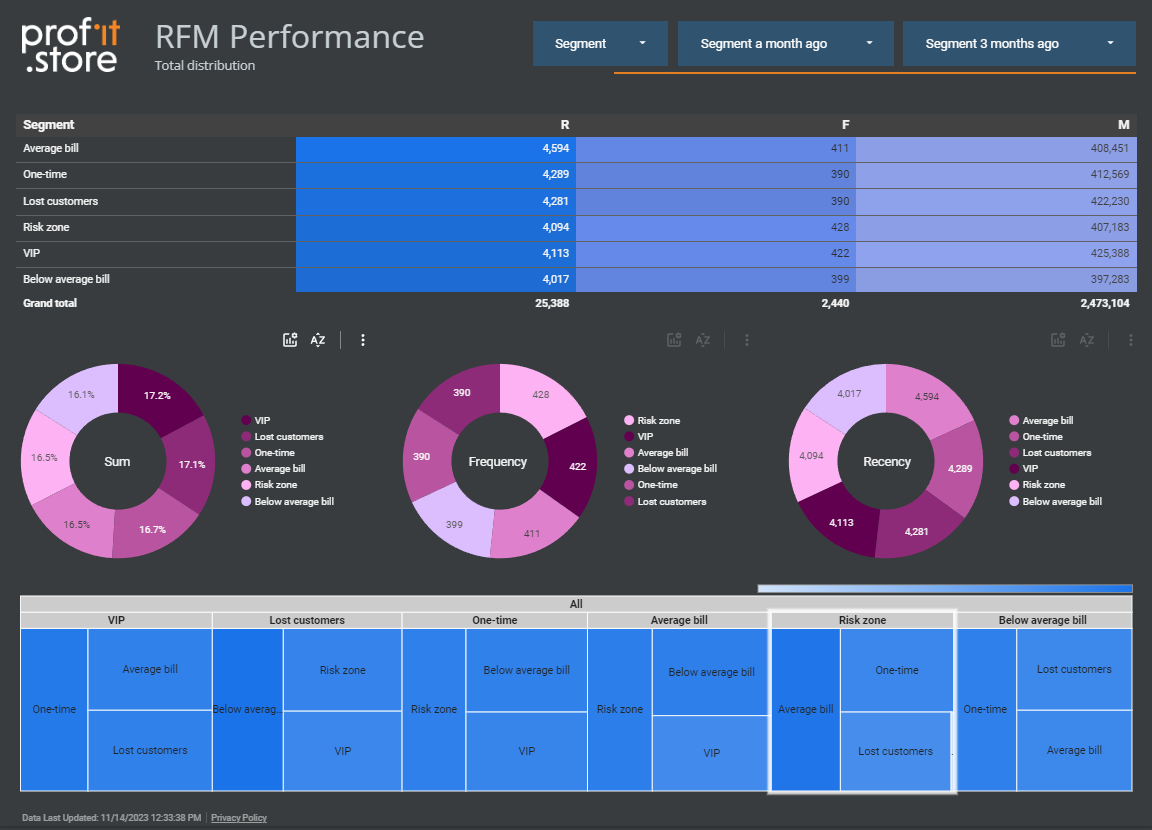
Here you can clearly see how many customers are in each segment. By default, the data is compared with 30 days. In this way, we can see the dynamics of users for each segment.
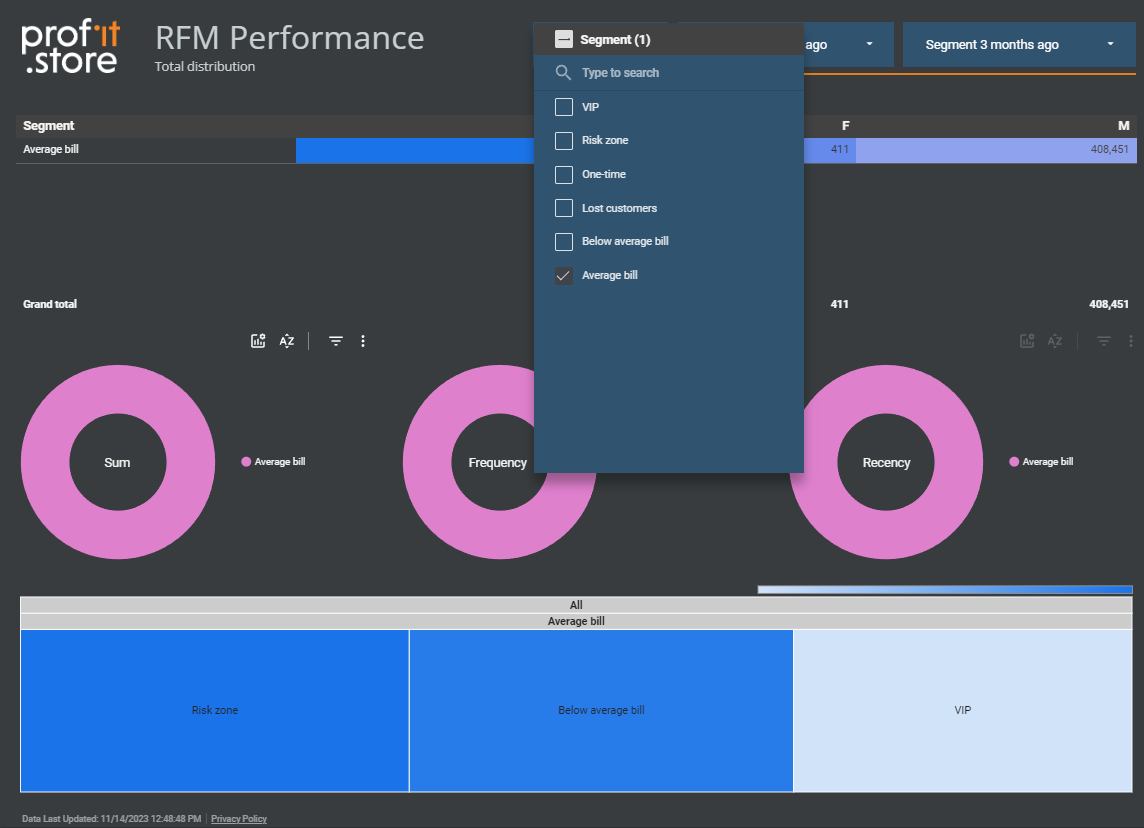
We implemented the possibility to select a specific segment and "decompose it into atoms".
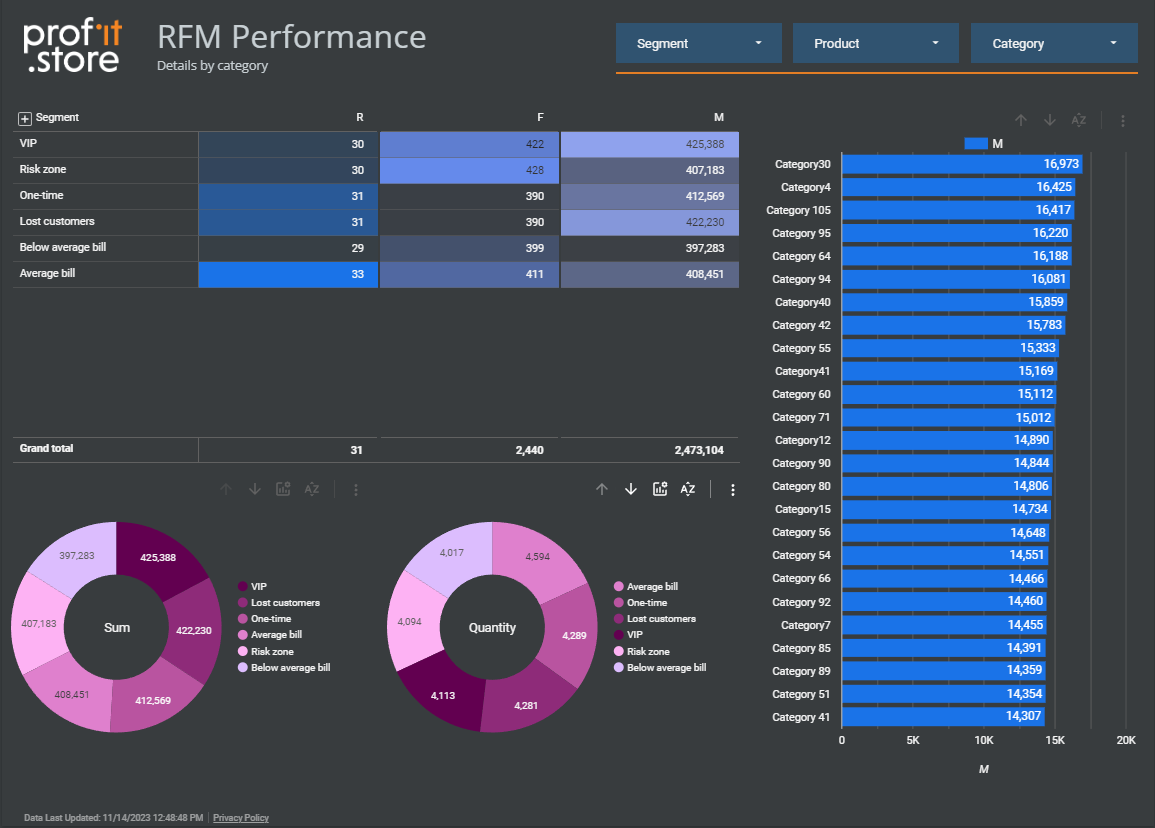
Segment detailing
And here is the detailing of categories, groups and products for each segment.
This is the general picture, and now I will show what it is in detail:
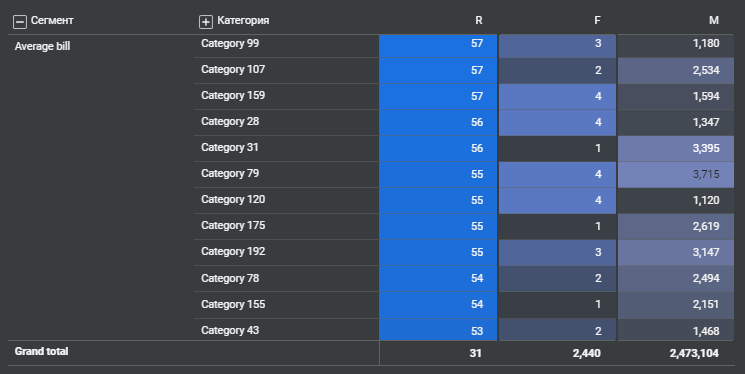
For example, all the RFM indicators for each category of products.
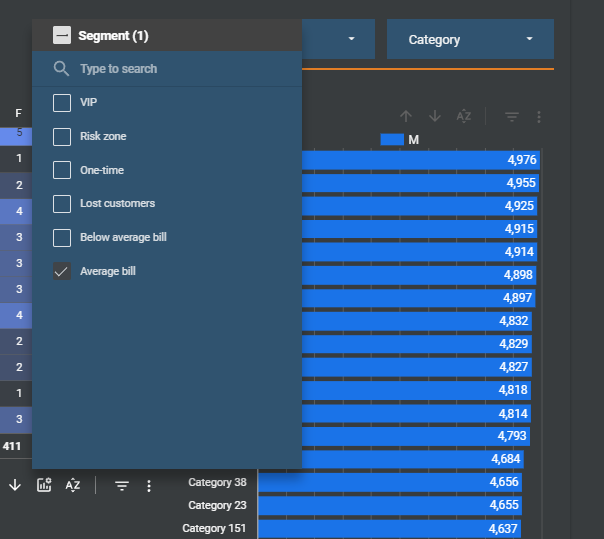
If you choose a specific segment on the filter, you will get details by categories, groups and all products.
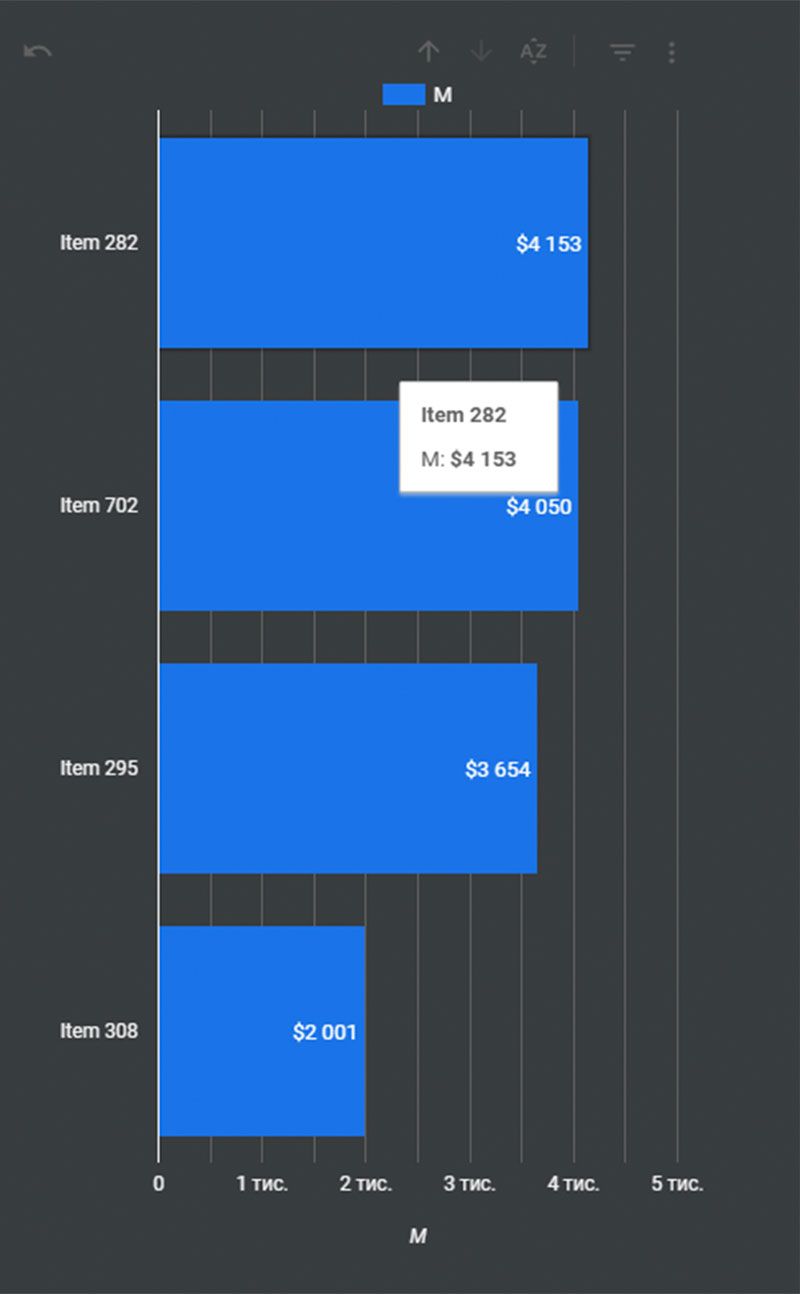
Summarizing, we understand that we have all the necessary information, namely who, when, how much, how often, what size, color, model bought, and who specifically wanted what and left it in the basket for certain reasons.
Such information is enough for us to build personalized autofunnels.
Automation via API
3-4. Fortunately for us, the right advertising services have great APIs that allow us to perform actions from external systems, in our case from our BI system. What does it give?
In the Google Ads advertising cabinet, a corresponding remarketing list was created for each RFM segment, and the same was done with the Meta advertising cabinet. In the future, when a client in the BI system moved from the segment "regular customers" to, for example, the "risk zone", he, thanks to requests to the API, moved from one remarketing list to another and, accordingly, began to see advertising that was configured specifically for this list. In this way, we managed to show advertising offers in a relevant way.
Unfortunately, only the email channel showed its uselessness, the conversions to opening were very low, so we decided to make the "most delicious lead magnet" and send the offer with it to the entire base.
The trick was that you could get it only by subscribing to the chatbot in the messenger. At the conclusion of a series of mailings, it was possible to transfer almost 40% of the customer base to the chatbot, where the percentage of opening messages was more than 80. Thus, the automated advertising funnel in symbiosis with our BI system began to sell relevant products to the existing base, and, accordingly, LAC (cost lead) and CAC (customer cost) fell sharply, which allowed the advertising budget to be used to find new channels.
End-to-end analytics
- Here, of course, we used our 5-dashboard campaign performance analysis system.
You can read about it n this article.
We managed to save advertising budgets and the processes derived from them. A significant reduction in the price of a lead and a customer helped to balance the cash register and get rid of cash gaps, and the transition to planning began. The client received a tool for working with the client base and a powerful system for analyzing the effectiveness of advertising from an advertising banner to a marketer or an advertising agency.
Analyze and manage, basing decisions on solid data, because you manage exactly what you measure and analyze!
SHARE
OTHER ARTICLES BY THIS AUTHOR
Get the most exciting news first!
Expert articles, interviews with entrepreneurs and CEOs, research, analytics, and service reviews: be up to date with business and technology news and trends. Subscribe to the newsletter!


