


Perfect analytics for online schools
The analytical system that you are free to use.


How did we develop the perfect online school analytics system in 12 days?

Projecting

Presentation of the finished system

Planned

Perfect analytics in 7 days

6-8 dashboards

44 indicators
Received
Perfect analytics in 12 days
5 dashboards
68 indicators
Main marketing dashboard
for an owner or manager of an online school

- This dashboard was created for making management decisions based on current data with regular updates.
- The interactive report contains performance indicators for traffic channels, landing pages, and creatives.
- It provides an opportunity to analyze the selected period, and shows the percentage of plan execution for each key indicator.
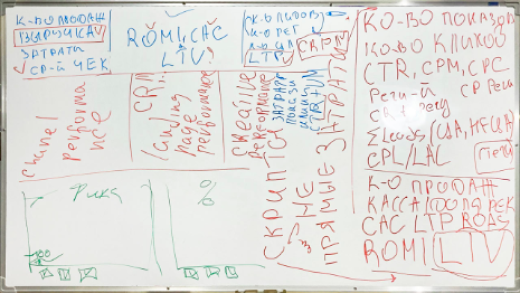
Main marketing dashboard
- Payments amount
- Total income
- Expenses
- ROMI
- ROAS
- CAC
- LTP
- Registrations
- Leads amount
- Leads cost
- Targeted leads amount
- Average bill
- Execution of the plan
- Advertisement share
- LTV
- CR
- Ad views
- Clicks
- CTR
- Following
Traffic performance dashboard
for a marketing team
- This is an interactive dashboard of end-to-end analytics, that describes the effectiveness of advertising campaigns throughout the whole structure of advertising channels with a cabinet hierarchy and UTM tags.
- Full detailing of channels with advertising cabinets and organic traffic. No activity will go unnoticed.
- Regular data updates make it possible to react quickly and manage advertising companies.
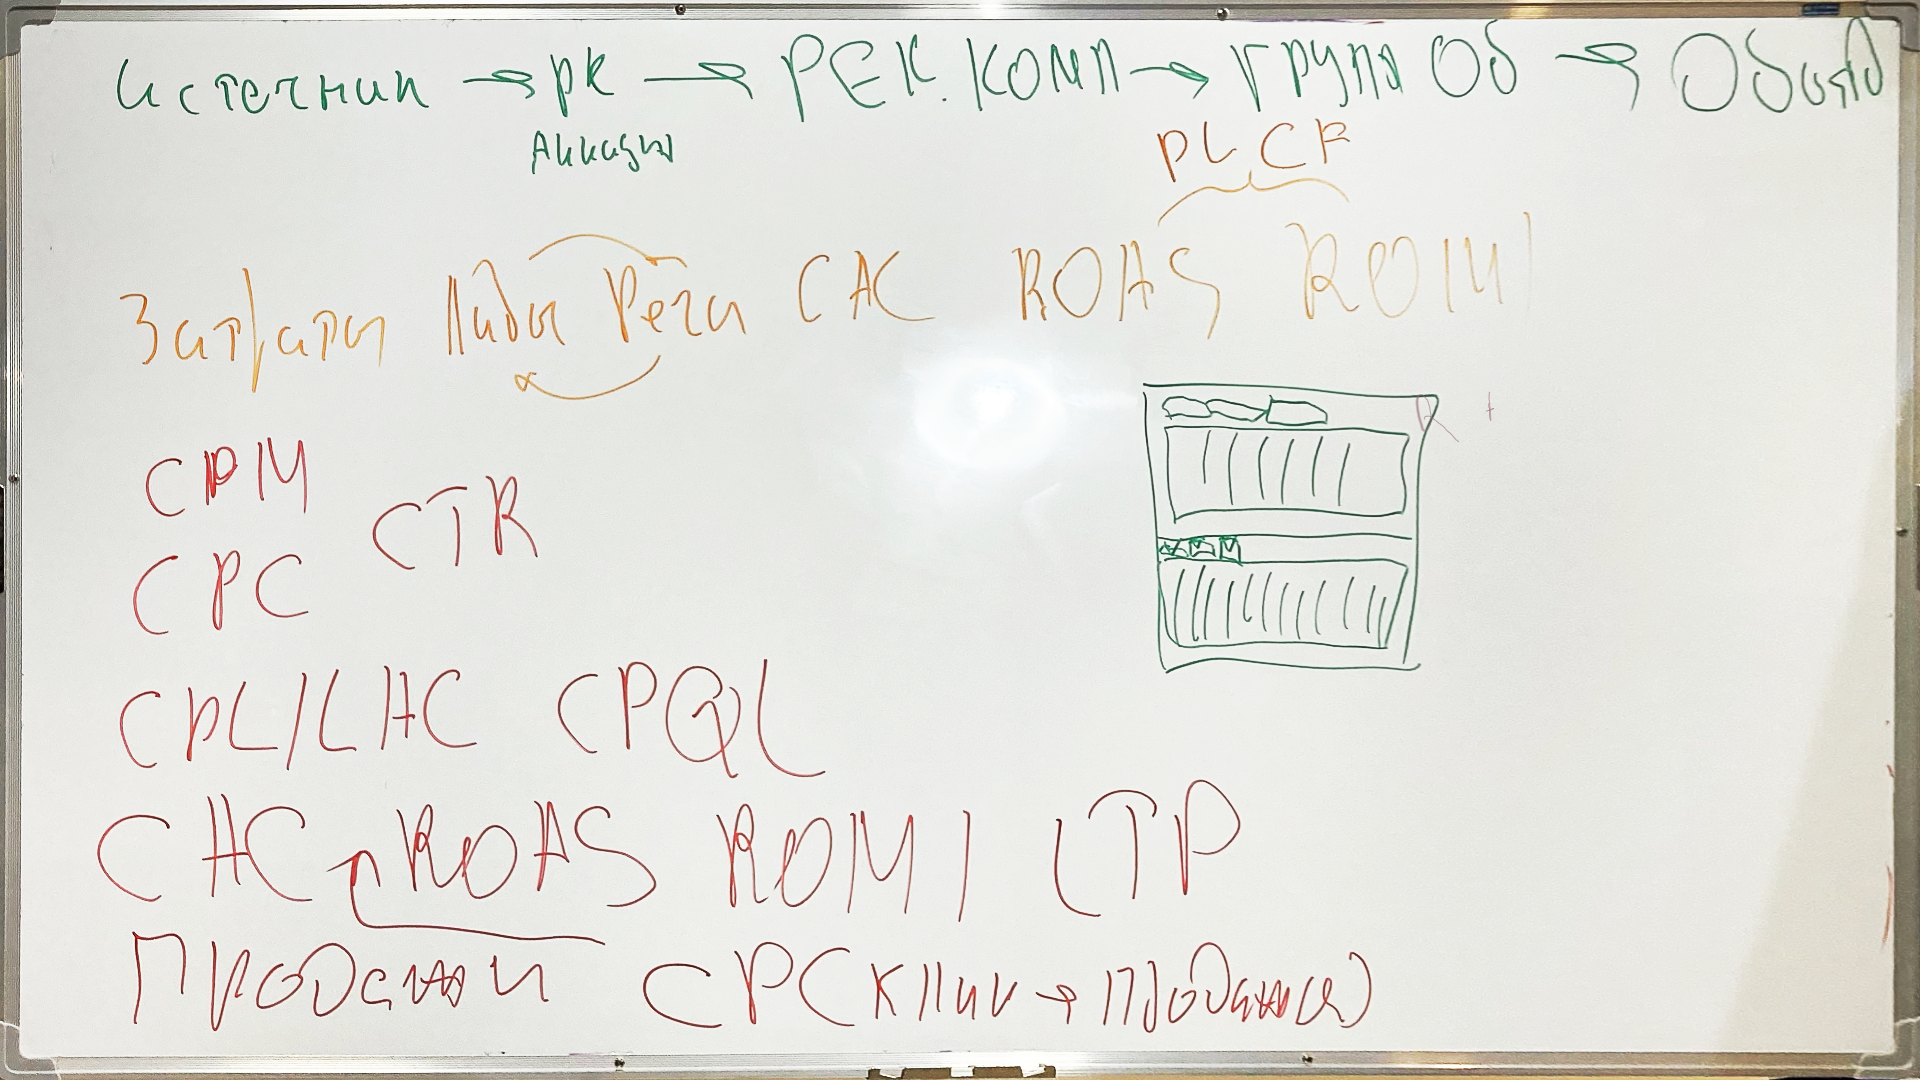
Traffic performance dashboard
- Expenses
- Leads amount
- Orders amount
- Payments amount
- Sum of payments
- Sum of orders
- ROMI
- Average bill
- Order to payment CR
- Lead to payment CR
- LAC
- CAC
- LTV
- ROAS
- ARPU
Funnel dashboard
for an owner and marketing team
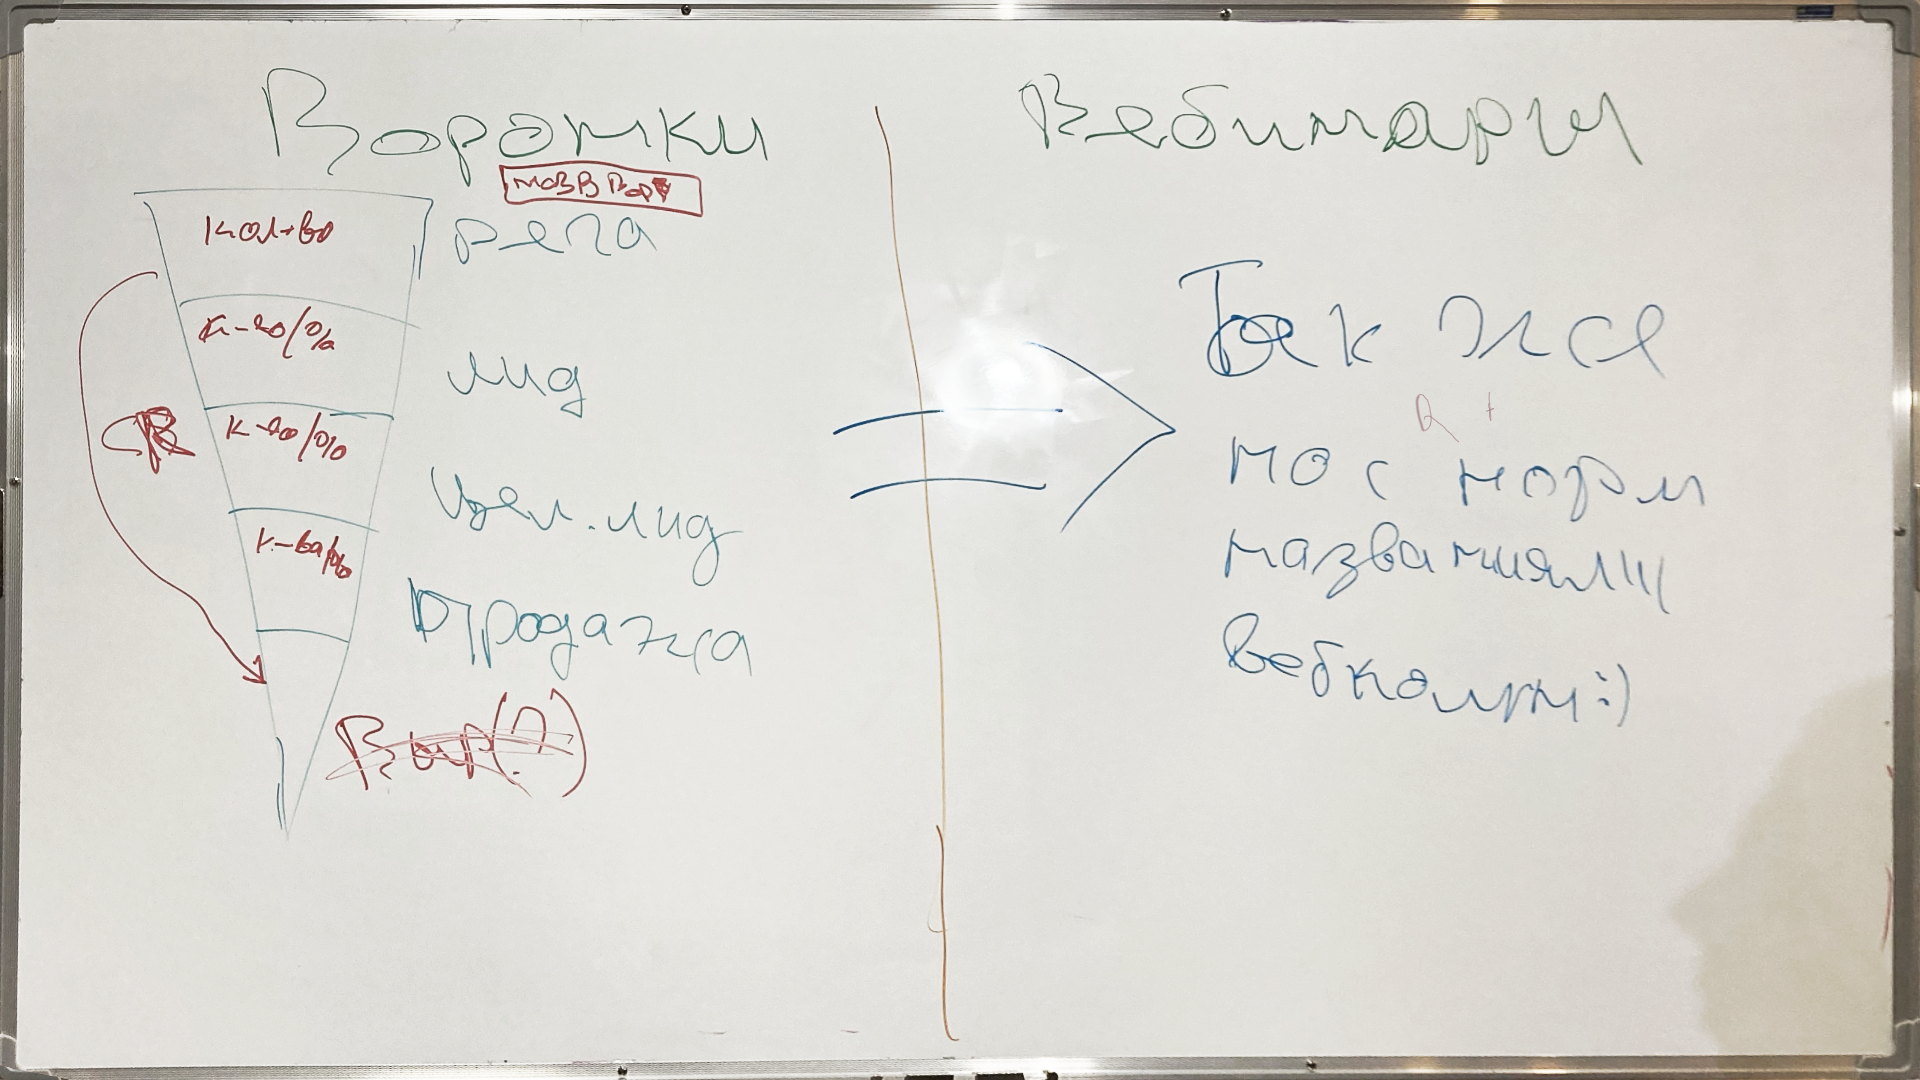
- This is an interactive funnel dashboard that shows the stages of conversion on the customer journey.
- You can explore the funnel from lead to payment in terms of a specific trip wire, lead magnet, product, or webinar.
- There is also an opportunity to study all the statuses of deals on a specific CRM funnel by product or object from the sales funnel.
Funnel dashboard
- Registrations
- Targeted actions
- Targeted leads
- Applications
- Sales amount
Marketing KPI dashboard
for an owner or manager of an online school
- This is a management dashboard of key quantitative and qualitative indicators in marketing.
- Full detailing of the number and value of qualified and general leads for the selected time period.
- The customer journey details of every funnel and webinar.
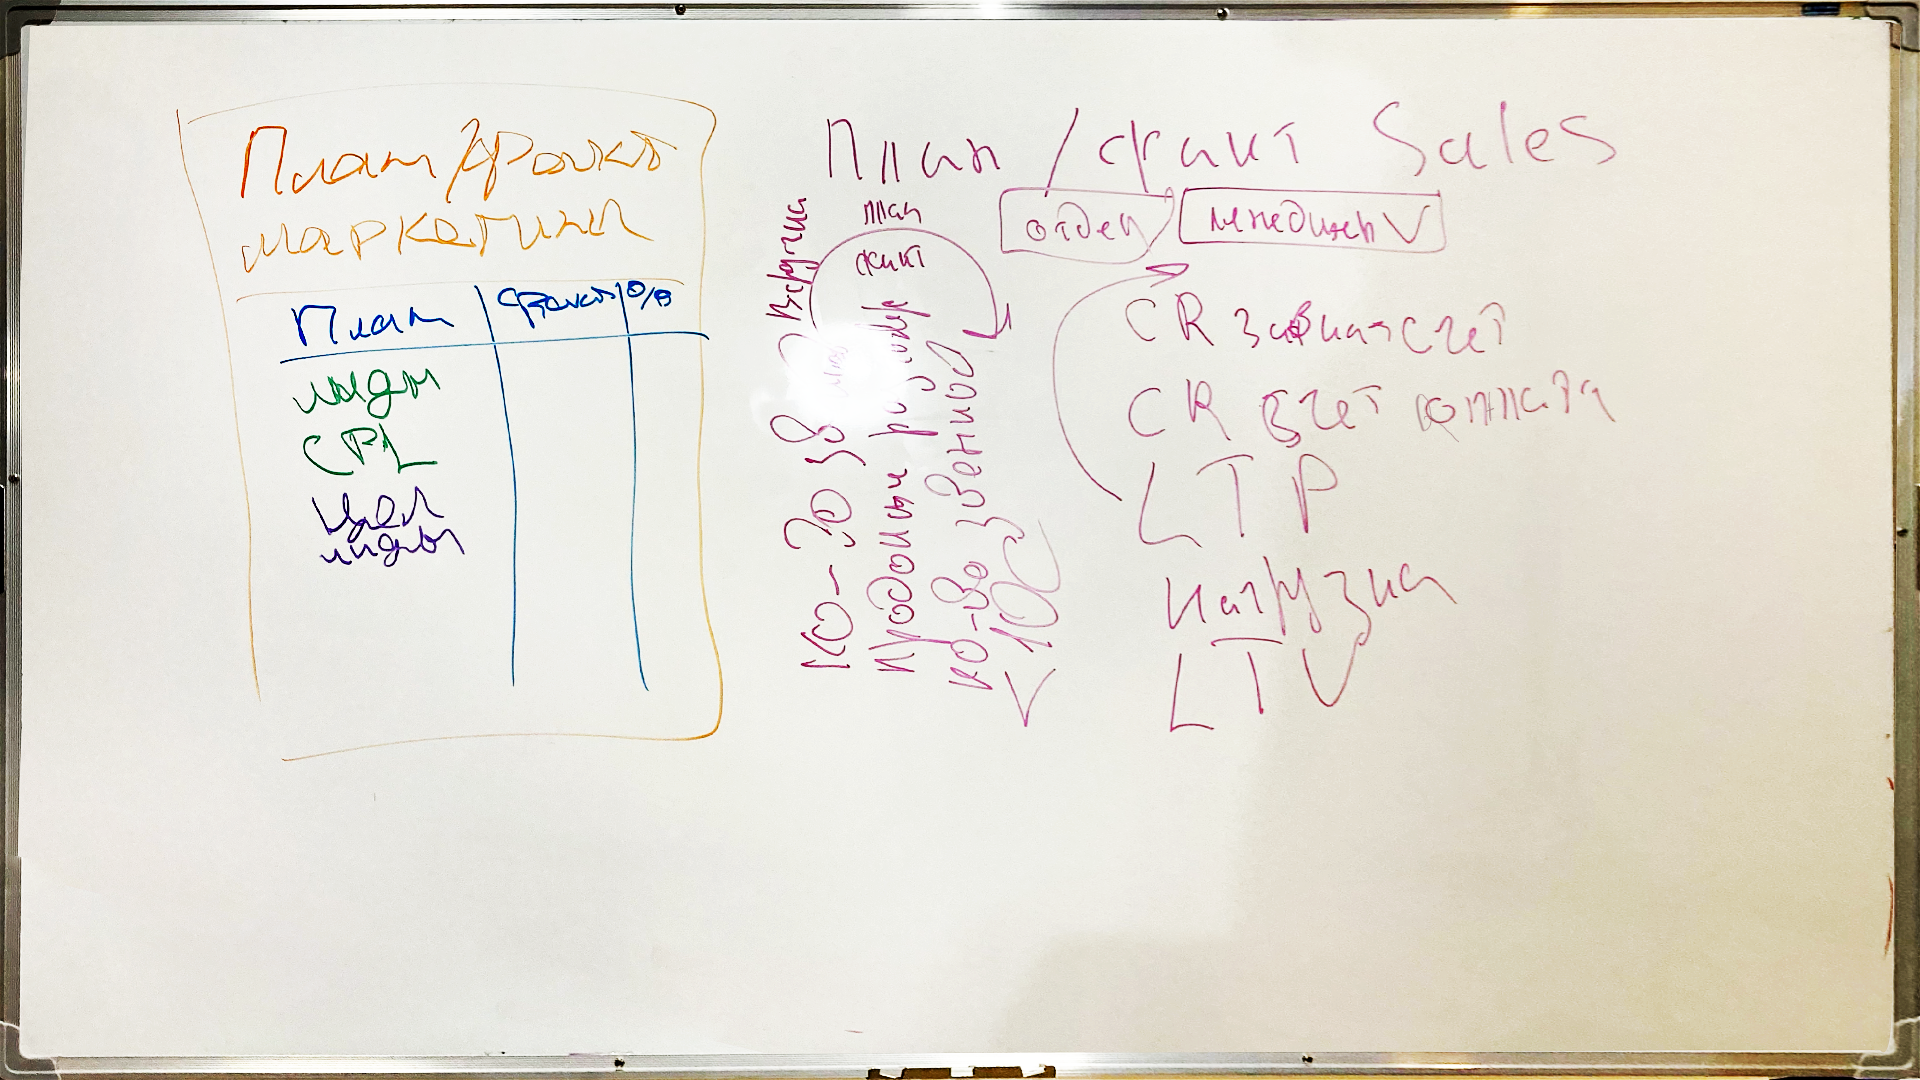
Marketing KPI dashboard
- Planned leads
- Actual leads
- Planned qualified leads
- Actual qualified leads
- Leads % completion
- Leads % variance
- CPL plan
- CPQL plan
- Actual CPL
- Actual CPQL
- Sales % execution
- Sales % variance
Sales KPI dashboard
for an owner and sales manager
- This is an interactive dashboard with full details of sales indicators by a specific manager or department.
- Full detailing of sales by products, packages, upsells, cross-sells, down-sells for every manager for the selected time period.
- It provides an opportunity to analyze the effectiveness of scripts for each manager and product.
Sales KPI dashboard
- Deal cycle
- LTP
- Execution of the plan
- Application - bill CR
- Bill - payment CR
- Lead - application CR
- Workloads
- LTV
- Leads by script
- Payments by script
- Input line duration
- Output line duration
What problems of online schools can be solved by using end-to-end analytics?
- Increase in income
- Effective use of the advertising budget
- Control of employees' work and salary calculation based on KPI
- Effective planning based on numbers
- Making management decisions based on solid data
- Automation of data collection


CPM
Cost Per Millenium - refers to the cost of advertising per one thousand impressions.
CPC
Cost per Click - refers to the cost of advertising per each click on the ad.
CTR
Click-Through Rate - represents the percentage of ad clicks compared to the total number of ad impressions.
CPA
Cost per Action - refers to the cost of advertising per each user action (such as a purchase or form submission).
CPL/LAC
Cost per Lead / Lead Acquisition Cost - represents the cost of advertising per each acquired lead.
CPQL/LAQL
Cost per Qualified Lead / Lead Acquisition Qualified Lead - refers to the cost of advertising per each acquired qualified lead.
LTP
Lead to Pay is the ratio between the number of leads that convert to payment and the total number of leads engaged in the sales funnel.
QLTP
Qualified lead to pay is the ratio between the number of qualified leads that convert to payment and the total number of qualified leads that are engaged in the sales funnel.
CAC
Customer Acquisition Cost - refers to the cost incurred to acquire a new customer for the company.
LTV
Lifetime Value - represents the estimation of the total profitability of a customer for the company throughout their lifetime.
ROAS
Return on Advertising Spend - represents the ratio of revenue generated from advertising compared to the cost of that advertising.
ROMI
Return on Marketing Investment - represents the ratio of revenue generated from marketing investments compared to the overall marketing expenses.
Step-by-step implementation plan
The concept of using analytics

Development of control dashboards
Automation of data import
Development of logic and dashboarding
Final testing
Technical support
552
developed dashboards
83
analyzed indicators
25%
increase in client efficiency
4080
saved hours per year
45
data import systems